Introducton
This document is part of the PAE-IoT Parks and Gardens Project.
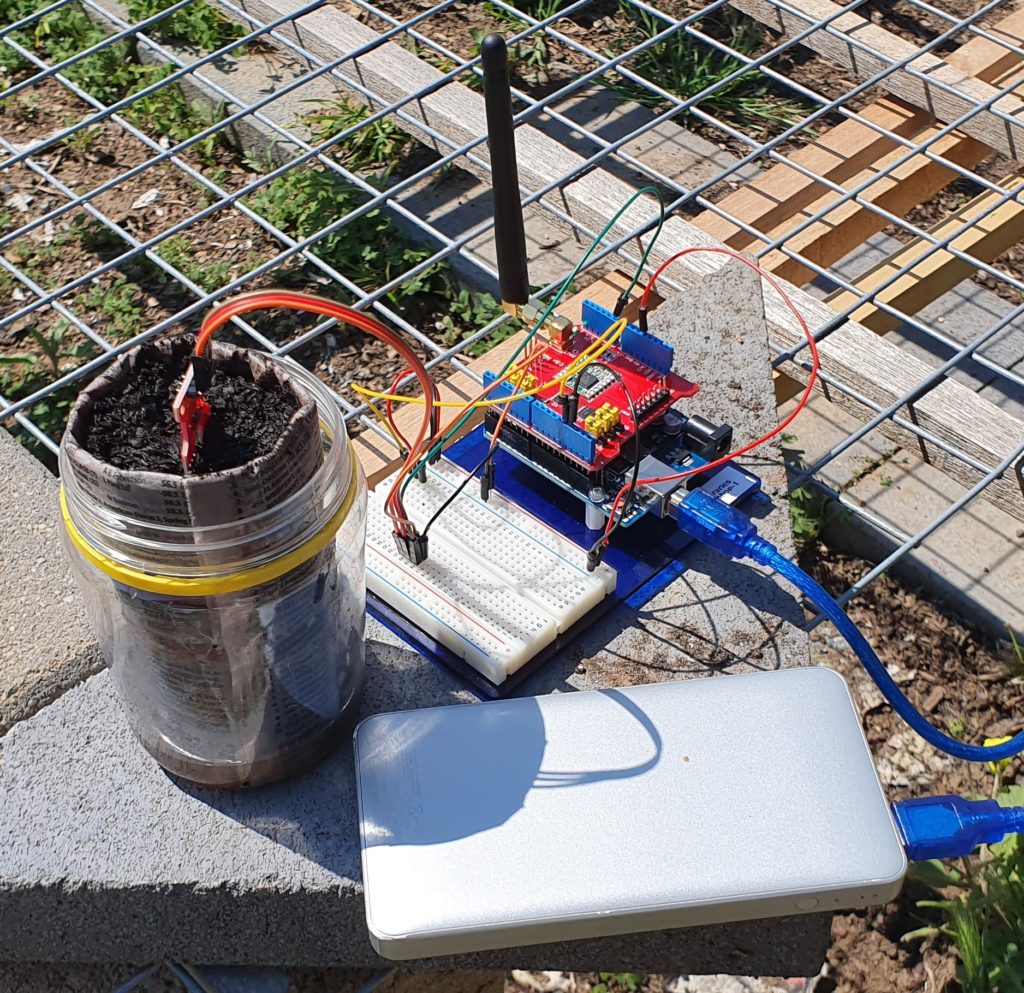
The aim of this post is to document the configuration details needed to setup a new temperature sensor which was deployed as part of the Port Adelaide-Enfield Library/Parks and Gardens collaboration, for monitoring the environment around a newly built sports ground and playing surface.
It is a fairly long document and aims to explicitly describe the code that is needed to set up the new data path. It is built on top of the existing data handling system (The Things Network, NodeRED, InfluxDB and Grafana) which has been described in previous posts, so it isn’t a complete explaination of this system.
More details about the project, including the live sensor data, can be found on the project pages:
- https://stemlibrary.space/recreational-surfaces/
- https://stemlibrary.space/temperature-probes/
- https://stemlibrary.space/temperature-probe-data/
The Hardware – Temperature Sensor
General information (from The Things Network)
Device Id:       eui-a840416eb183975f
Description:     LSN50V2-D23 LORAWAN WATERPROOF TEMPERATURE SENSOR (3 PROBES)
Frequency plan:  Australia 915-928 MHz, FSB 2 (used by TTN)
LoRaWAN version: LoRaWAN Specification 1.0.3
Regional Parameters version: RP001 Regional Parameters 1.0.3 revision A
Hardware
Brand:            dragino
Model:            lsn50v2-d20-d22-d23
Hardware version: unknown_hw_version
Firmware version: lsn50v2-d20-d22-d23 1.7.5
Note: The LoRaWAN Regional Parameters is set to “Version 1.0.3 Revision A”. This is different to what was found to work with custom developed sensors. It is unclear at this stage what the actual difference is.
The Things Network (TTN) Configuraton
The sensor was easily registered with The Things Network, as the hardware has been pre-configured with a hardware profile from The Things Network Device Repository. This configures the network parameters (as described in the previous section) as well as data formatting functions.
The current Formatter Code returns four data points (Temp_Black, Temp_Red, Temp White, and BatV) and two status values (Work_Mode and ALARM_status).
The code for this uplink data formatting function is as follows:
function decodeUplink(input) {
	var port = input.fPort;
	var bytes = input.bytes;
	var mode=(bytes[6] & 0x7C)>>2;
	var data = {};
	 switch (input.fPort) {
		 case 2:
if(mode=='3')
{
  data.Work_mode="DS18B20";
  data.BatV=(bytes[0]<<8 | bytes[1])/1000;
  data.ALARM_status=(bytes[6] & 0x01)? "TRUE":"FALSE";

  if((bytes[2]==0xff)&& (bytes[3]==0xff))
  {
    data.Temp_Red="NULL";
  }
  else
  {
    data.Temp_Red= parseFloat(((bytes[2]<<24>>16 | bytes[3])/10).toFixed(1));
  }

  if((bytes[7]==0xff)&& (bytes[8]==0xff))
  {
    data.Temp_White="NULL";
  }
  else
  {
  	data.Temp_White=parseFloat(((bytes[7]<<24>>16 | bytes[8])/10).toFixed(1));
  }

  if((bytes[9]==0xff)&& (bytes[10]==0xff))
  {
    data.Temp_Black="NULL";
  }
  else
  {
  	data.Temp_Black=parseFloat(((bytes[9]<<8 | bytes[10])/10) .toFixed(1));
  }
}
else if(mode=='31')
{
  data.Work_mode="ALARM";
  data.Temp_Red_MIN= bytes[4]<<24>>24;
  data.Temp_Red_MAX= bytes[5]<<24>>24;
  data.Temp_White_MIN= bytes[7]<<24>>24;
  data.Temp_White_MAX= bytes[8]<<24>>24;
  data.Temp_Black_MIN= bytes[9]<<24>>24;
  data.Temp_Black_MAX= bytes[10]<<24>>24;
}

  if(bytes.length==11)
  return {
      data: data,
    }
	break;
default:
    return {
      errors: ["unknown FPort"]
    }
  }
}
The data that is then sent through to NodeRED via the MQTT service is a text formatted JSON data structure.
Comments
In previous PAEIoT projects, the decoding of the LoRaWAN uplink data has been done at a later step, in NodeRed. It was done like this for two reasons: 1) The encoded LoRaWAN packets were smaller for transmitting over the network; and 2) Understanding how to decode and process the data could be done separately to anything that TTN does.
Both of these conditions have changed.
In Version 3 of the TTN service, a lot more meta-data about the network is sent with the sensor data, so any advantages of savings made with minimising the size of the internet packet is lost.
As the uplink data formatting code is automatically included by the manucaturer, is available and open-source, provided thatit works, there is no advantage to not using it.
NodeRed and InfluxDB – Data Procesing and Storage
The following flow diagram describes the new path and changes added to support the new temperature sensor.
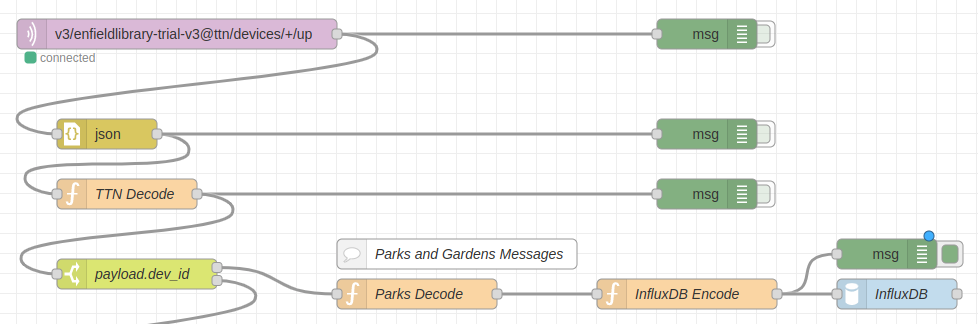
Specifically, the following changes and details were added.
TTN Decode (minor change)
The “TTN Decode” node now also passes the entire “uplink_message”, rather than just “payload_raw”. This means that the sensor location (longitude, latitude, and elevation) can be set via the registraion of the device in TTN.
payload.dev_id – Switch (New Output Added)
Added switch to separate flow for the Parks and Garden device (dev_id=eui-a840416eb183975f).
Note: When additional sensors are added, this switch node will need to be changed to also select the new sensor.
Parks Decode – Function (New)
This is the main function which pulls out and renames the data. The ‘msg.payload’ contains this data, and ‘msg.meta’ contains tags for the data.
// Parks Decode
// Decode temperature sensing device
// LSN50V2-D23 LORAWAN WATERPROOF TEMPERATURE SENSOR (3 PROBES)
var device_id = msg.payload.dev_id;
var batv = msg.payload.uplink_message.decoded_payload.BatV;
var temp_black = msg.payload.uplink_message.decoded_payload.Temp_Black;
var temp_red = msg.payload.uplink_message.decoded_payload.Temp_Red;
var temp_white = msg.payload.uplink_message.decoded_payload.Temp_White;
var latitude = msg.payload.uplink_message.locations.user.latitude;
var longitude = msg.payload.uplink_message.locations.user.latitude;
var altitude = msg.payload.uplink_message.locations.user.altitude;
var data = {};
data.batv = batv;
data.temp_black = temp_black;
data.temp_red = temp_red;
data.temp_white = temp_white;
data.temp_air = temp_white;
data.temp_surface = temp_red;
data.temp_ground = temp_black;
data.latitude = latitude;
data.longitude = longitude;
data.altitude = altitude;
msg.payload = data;
msg.meta = {
"device_id": device_id,
};
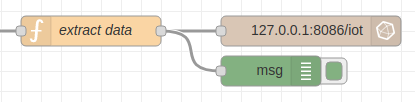
return msg;InfluxDB Encode – Function (Copied)
This function is the same as prevously used to format the payload prior to sending it to the InfluxDB node (and into the database).
// InfluxDB Encode
var bucket = "paeiot-bucket"
var device_id = msg.meta.device_id;
var fields = msg.payload;
msg.payload = {
bucket: bucket,
data: [{
measurement: 'sensor',
tags: {
"dev_id": device_id
},
fields: fields
}]};
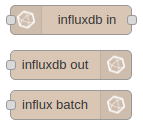
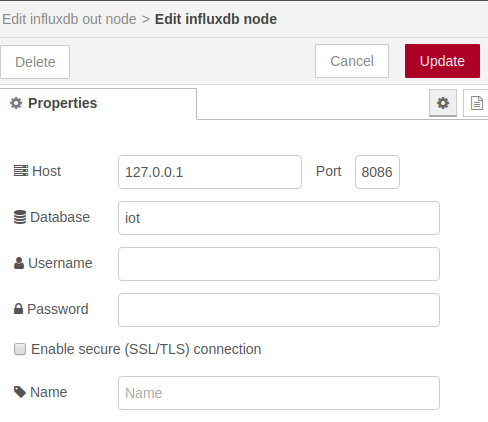
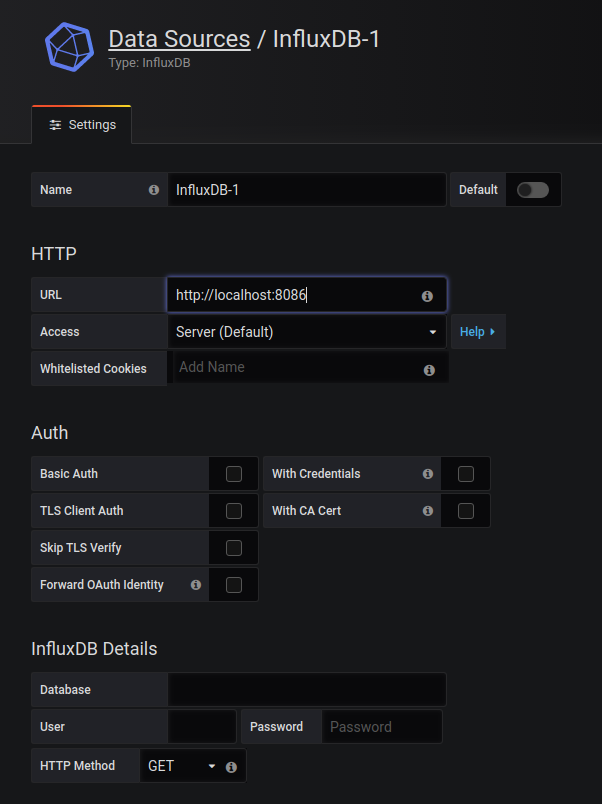
return msg;InfluxDB – Database Node (Copied)
This uses the existing configured node without any changes.
Grafana Dashboard
A new folder and dashboardwas created to display the temperature data.
Parks and Gardens / Playing Ground Temperatures
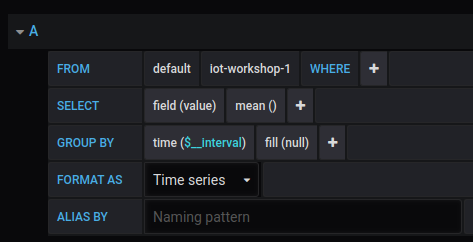
The query used to return the air temperature (temp_air) is the following:
from(bucket: "paeiot-bucket")
 |> range(start: v.timeRangeStart, stop: v.timeRangeStop)
 |> filter(fn: (r) => r["_measurement"] == "sensor")
 |> filter(fn: (r) => r["dev_id"] == "eui-a840416eb183975f")
 |> filter(fn: (r) => r["_field"] == "temp_air")
 |> drop(columns: ["dev_id", "latitude", "longitude", "altitude"])
 |> aggregateWindow(every: v.windowPeriod, fn: mean)
 |> yield(name: "mean")
An addtional two queries pull out the data for the surface temperature (temp_surface) and ground temperature (temp_ground) with the filter for the ‘_field’ value being changed respecfully. eg.
filter(fn: (r) => r["_field"] == "temp_surface")
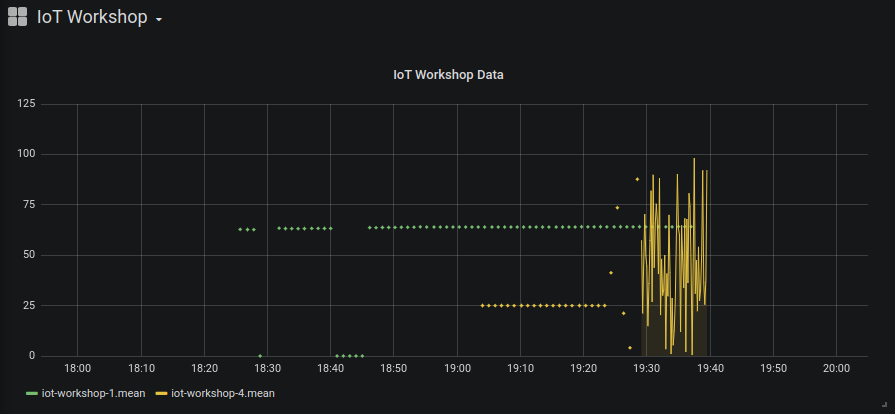
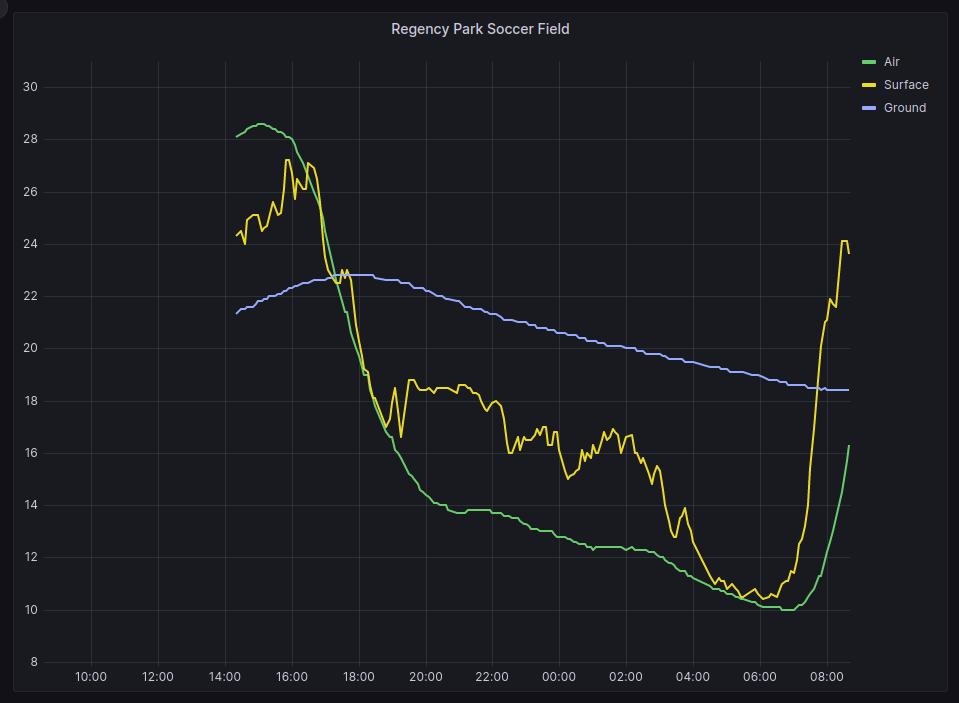
filter(fn: (r) => r["_field"] == "temp_ground")The resulting graph (as shown at the top of this post) also has some additional formatting changes (overrides), as pseudo-code:
Where field has name "temp_air", change Display Name to  "Air";
Where field has name "temp_surface", change Display Name to  "Surface";
Where field has name "temp_ground", change Display Name to  "Ground";
Conclusion
The existing PAE-IoT data processing system was modified to allow data from a newly added, commercially available temperature sensor, to be stored, displayed and dynamically updated.
A moderate amount of changes were required due to choices made by the hardware and system vendors. The system design choices that were made were informed by the desire to minimise additional changes if more sensors are added or if the system is extended in other straight forward ways.
This documentation is part of this process.