In the last part of this blog post series, we look at pulling everything together with InfluxDB and Grafana to store and display outr IoT sensor data.
Tools to Collect and Display Data
In the workshop we are using the following software tools for processing our collected data.
- Node-RED – Receive, Process and Push IoT sensor data
- InfluxDB – Store the time series of sensor data
- Grafana – Display and manipulate the data visualisation
These packages can easily be installed on a Ubuntu system (desktop or laptop) as well as Raspberry Pi Raspian system[1]. In the following I have included the instructions for installing on Ubuntu.
This combination of software will allow data to be displayed is graphs which can be interactively arranged and manipulated, and shared with multiple users on your network.
Node-RED
The installation and configuration of Node-RED was discussed in the previous post. An additional module needs to be install to allow Node-RED to send data to InfluxDB.
node-red-contrib-influxdb
InfluxDB
InfluxBD is a time series data store, which is like a database, but different. It is designed for storing and retrieving sequential data which contains timestamps in a more efficient way.
To install
$ sudo apt install influxdb influxdb-client
It uses the default port of 8086.
Before we are able to start storing data, a database needs to be created in InfluxDB, which we can then push our time series data into. This is done from the Linux commad line ($) as follows: First open a influx prompt (>), then create the ‘iot’ database.
$ influx -precision rfc3339
> create database iot
From the influx prompt (>) you can find out more about the available databases
> show databases
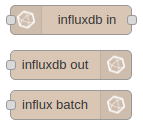
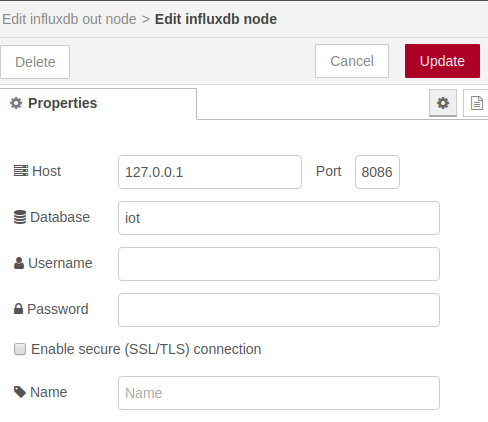
Node-RED can then be configured to push data to this database with the InfluxDB output node, configured as follows.
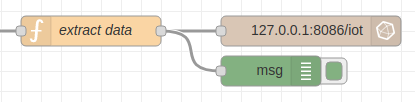
A flow can then be configured to pull the data from a Node-RED message and send it to the InfluxDB.
The function used to extract moisture data (analog to digital data in the range 0-1023) is as follows. An additional format check (message starts with “Sensor”) has been added in case some other format is received. The device (device_id) that is reporting the data is specified in the ‘msg.measurement’ field.
var payload = msg.payload.payload_fields.receivedString
var dev_id  = msg.payload.dev_id
var re      = /^Sensor/;
var moisture = 0.0;
if(re.test(payload)){
   payload = payload.substring(10)
   var integer = parseInt(payload,16)
   moisture = integer/1024.0 * 100.0
 }
 msg.measurement = dev_id
 msg.payload = moisture
 return msg;
Grafana
Grafana is a graphing and visualisation package. It can display the information from InfluxDB[3] and display it.
To install[4]
sudo add-apt-repository "deb https://packages.grafana.com/oss/deb stable main"
wget -q -O - https://packages.grafana.com/gpg.key | sudo apt-key add -
sudo apt update
sudo apt install grafana
sudo /bin/systemctl daemon-reload
sudo /bin/systemctl enable grafana-server
sudo /bin/systemctl start grafana-server
Connect to the Grafana server with the URL
When logging in for the first time, you can use any username and password and you will be then prompted to change it.
Grafana is a very powerful piece of software but does a good job of helping the first time user through the initial setup. It is recommended that you have a read through the Getting Started documentation. The following is a very brief summary of the confugration process, and I have glossed over a lot of the details.
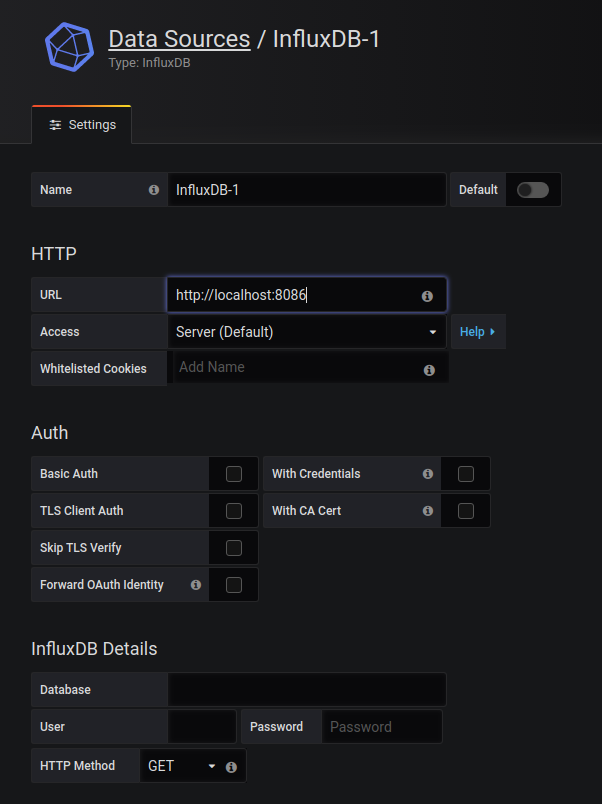
Once you login in, you will then be prompted for a data source. The details to connect to the local InfluxDB is as follows. Click and set the URL to http://localhost:8086 (it may just be displayed in grey which is a trap). There is no username or password needed if InfluxDB is installed as mentioned above.[5]

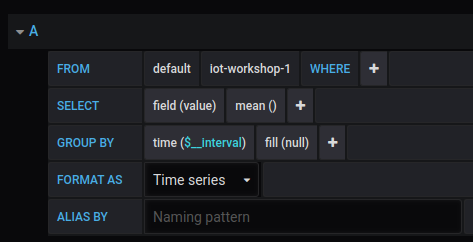
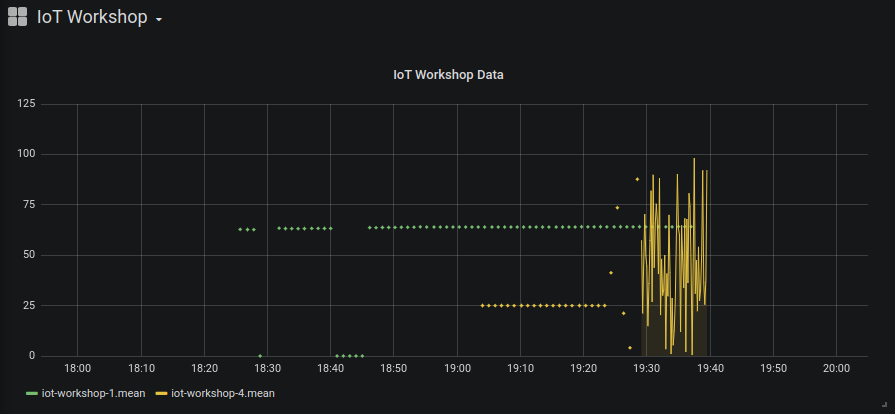
Grafana plots are configured by specifying a data query. In this case we are looking for data from the ‘iot-workshop-1’ device.
The following resulting plot came from defining two data queries for two IoT devices. The second one was configured to generate random data at 10 second intervals for testing purposes.
Notes:
[1] See: http://blog.centurio.net/2018/10/28/howto-install-influxdb-and-grafana-on-a-raspberry-pi-3/
[2] NodeRED is a general purpose automation framework and can do a lot more than mentioned here.
[3] As well as several other databases, including MySQL and PostgreSQL.
[4] See: https://grafana.com/docs/installation/debian/
[5] You realise that this this needs to be changed if your system is being run on a Internet accessible server, right?
Summary
This series of posts covered the process of building a private IoT platform for collecting and displaying sensor information that uses the Internet to move data about but does not rely on cloud or other 3rd party hosted services other than The Things Network.
There are no ongoing charges or fees with this system, and it is a good introduction to software which can then be adapated for other purposes. Have a look for YouTube videos on how to connect Node-RED to home management systems (Google Assistant or Amazon’s Echo) or create different dashboards with Grafana plugins