In the first session of the IoT workshop we presented a general introduction to the LoRaWAN IoT radio and The Things Network. In the second session we looked in more detail at getting an Arduino powered node connected to The Things Network and transmitting data packets.
In the third session, we are taking the data and looking at how it can be processed, in this case using the NodeRed tool.
Installation of Node-RED
Node-RED is a web server program which uses Node.js, which can be installed on a home computer, server, Raspberry Pi or in the Cloud. It can be used to collect and process the data collected by The Things Network[1].) We will be using MQTT to get access sensor data.
For supported Operating Systems and installation instructions, see: https://nodered.org/docs/getting-started/
On Linux Operating Systems (Ubuntu, Debian, Endebian etc.), Node-RED can be installed with
bash <(curl -sL https://raw.githubusercontent.com/node-red/linux-installers/master/deb/update-nodejs-and-nodered)

sudo systemctl enable nodered.service
It also appears to be installable on Windows 10 using the Windows Subsystem for Linux (WSL)[2].
Once installed, ot can be accessed via web browser connecting to port 1880. If it is installed on the local computer, ot can be accessed by visiting the URL – http://localhost:1880/
A User Guide with Tutorials are available from the Node-RED website[3]. If you have access to a working Node-RED server then the Tutorials are a good way to get started.
One final note. Flows are stored on the computer under the computers name (hostname). It that is ever changed, then the flows will not be loaded and it will look like your configuration has dissapeared. It is still there, and will reappear if the hostname is changed back. The easiest way to fix this is to export your flows to a file first (json) and then import them afterwards. This option is under the main menu.
Notes:
[1] Node-RED is a general purpose automation framework and can do a lot more than mentioned here,
[2] https://schellingerhout.github.io/bash%20on%20ubuntu%20on%20windows/nodered-windows/
[2] https://nodered.org/docs/
Working with Node-RED
Once Node-RED has been installed it can be accessed via port 1880.
Some additional packages are required. These are installed via the Manage Palette menu.
node-red-contrib-persist
node-red-dashboard
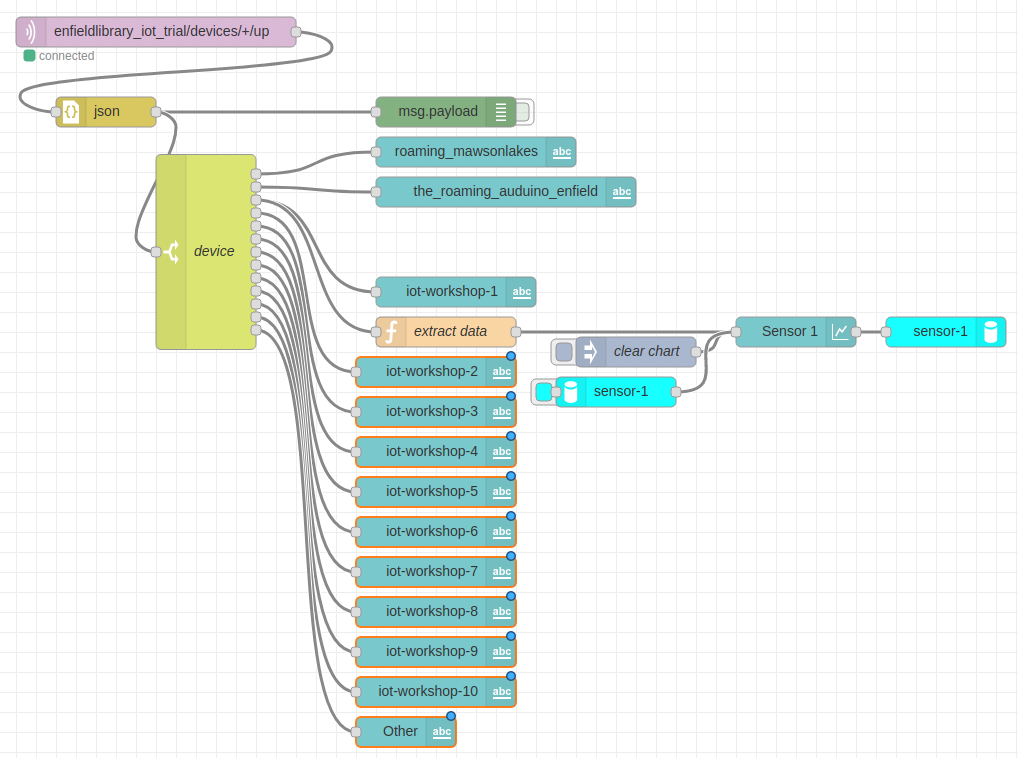
Configuration is done by connecting processing nodes with virtual wires to create flows. This allows messages to be processed as they pass through the system.

Data collected by The Things Network is pulled into Node-RED by using the MQTT node. This requires the name of The Things Network application and an application key/password.
Add an MQTT node and add a new mqtt-broker (server)
- Name: Something memorable eg. Meshed
- Connection
- Server: thethings.meshed.com.au
- Port: 1883
- SSL/TLS: (Unchecked)
- Use Legacy MQTT 3.1 support: (Checked)
- Security
- Username: enfieldlibrary_iot_trial
- Password: (application-key copied from TTN website, starts with ‘ttn-account-v2’)
The topic is the MQTT channel to subscribe to where ‘+’ is a wildcard and will match any device name.
enfieldlibrary_iot_trial/devices/+/up
There are a range of channels defined in the The Things Network API[1] covering different types of messages. Eg. up, down.
Node Decription
MQTT client
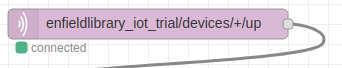
This node connects to The Things Network and subscribes to the defined topic. Any data sent by our LoRaWAN devices will be sent out this node.
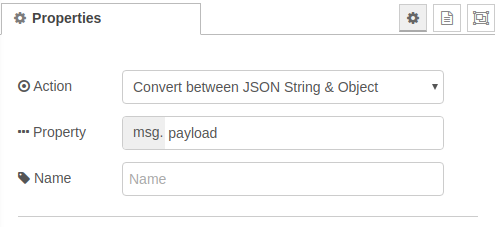
JSON
This node converts a text payload to JSON format. This is useful for allow later nodes to access individual parts of the payload.
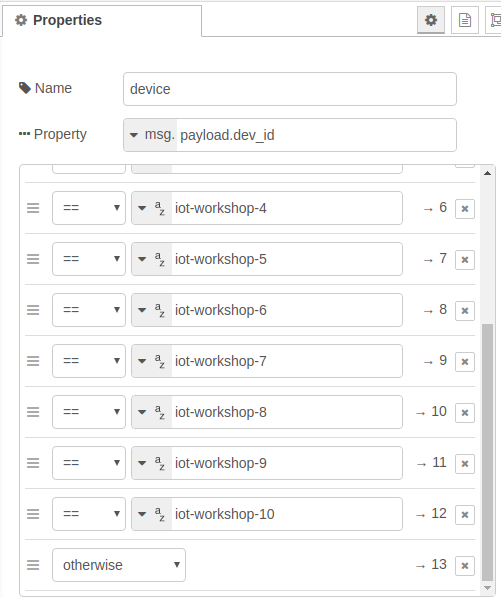
Switch
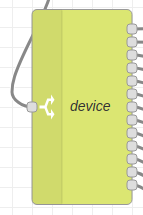
Diverts messages between different processing flows. In the above flow, it is being used to send device data to different dashboard labels. This allows us to display the latest data coming from each sensor.
Function
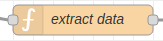
Code can be written in JavaScript to manipulate the messages passed to the node.
In our example we take the data transmitted by our device and received by The Things Network (eg. Sensor: 0x0267)[2], extract the data (substring) and convert to a meaningful number (moisture). This is passed directly to the next node in the payload of the message (the ‘msg’ variable).
var payload = msg.payload.payload_fields.receivedString
payload = payload.substring(10)
var integer = parseInt(payload,16)
var moisture = integer/1024.0 * 100.0
msg.payload = moisture

// To allow plotting of multiple series
msg.label = "sensor-1"

return msg;
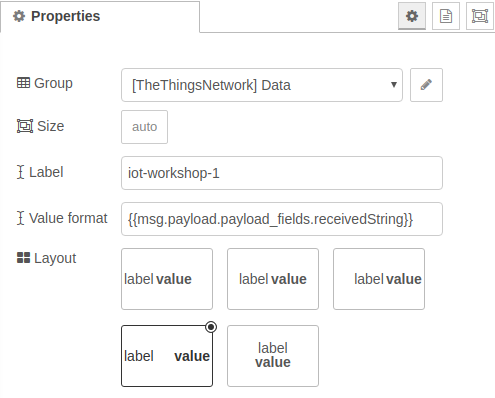
Dashboard Label
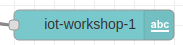
Creates label elements to display on the dashboard. These are updated by messages.
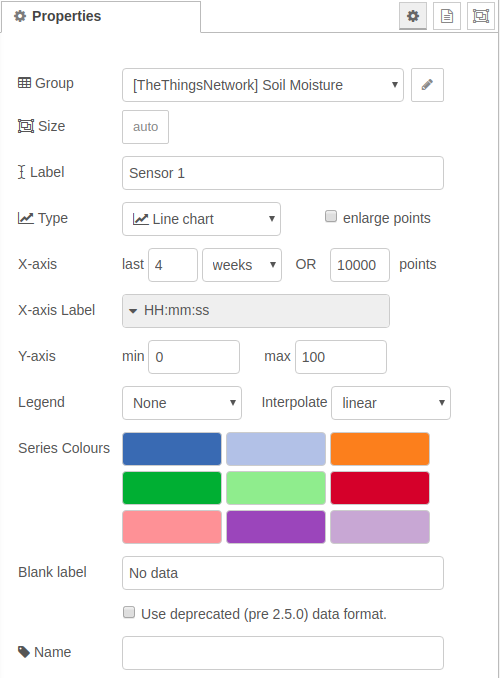
Dashboard Graph
Displays a graph from data. By default, the data is not permanantly stored and will not persist between flow deployments. The graph data can be stored persistantly by including save and restore nodes.
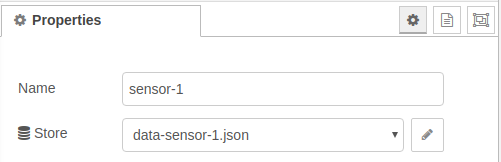
Persist (Save Data / Restore Data)
These nodes are used to ensure that the graphed data is persistent between reboots. Under particular conditions the date is written to a non-volatile location, and is read back into the system when starting up.
Multiple sets of data can be saved, but the save and restore nodes need to match.
Notes:
[1] https://www.thethingsnetwork.org/docs/applications/mqtt/api.html
[2] For the workshop there was a deliberate choise made to use ASCII strings to encode the data. This is inefficient, but allows the data to be easily viewed for training and debugging purposes. Have a look at Cayenne Low Power Payload (Cayenne LPP) for one encoding method to improve this.
Summary
The nodes above can be used in Node-RED to receive, display, graph and store data from LoRaWAN enabled sensors. It is a general purpose system and as such is missing some of the whistles and bells of some other systems.
Improvements can be made by hooking in some additional software packages. In particular, data can be stored in a database specifically designed to hold time series of sensor data (eg. InfluxDB[1]) and a more functional dashboard can be added for better graphing and analysis (eg. Grafana[2]).
Notes:
[1] https://www.influxdata.com/
[2] https://grafana.com/