Open Energy Monitor is a project based in Wales which has developed an energy and environmental monitoring system. They have an energy sensor (the emontx series) which monitors the current in up to four(4) channels, together with the AC voltage, in order to measure the power flowing through electrical circuits.
Current transformers are used, and are placed by clamping around individual wires, allowing the current in the wire to be measured without making any change or direct contact to the existing wiring.
The Open Energy Monitor store are selling their sensors as a kit, and one has been ordered with four current transformers. This will be paired with an already available Arduino UNO to allow for an evaluation of the monitoring software.
We are just after the power measurements for each channel to be reported via a serial connection rather than using their project specific radio (a 433MHz radio link).
All of the code that they are using (with and without the radio link) is available via their forum and github repository.
As we evaluate this system we will be posting the results here.
The Open Energy Monitor also has a good set of documentation on how the units work, how they have been put together, and more on the theory of energy monitoring using current transformers.
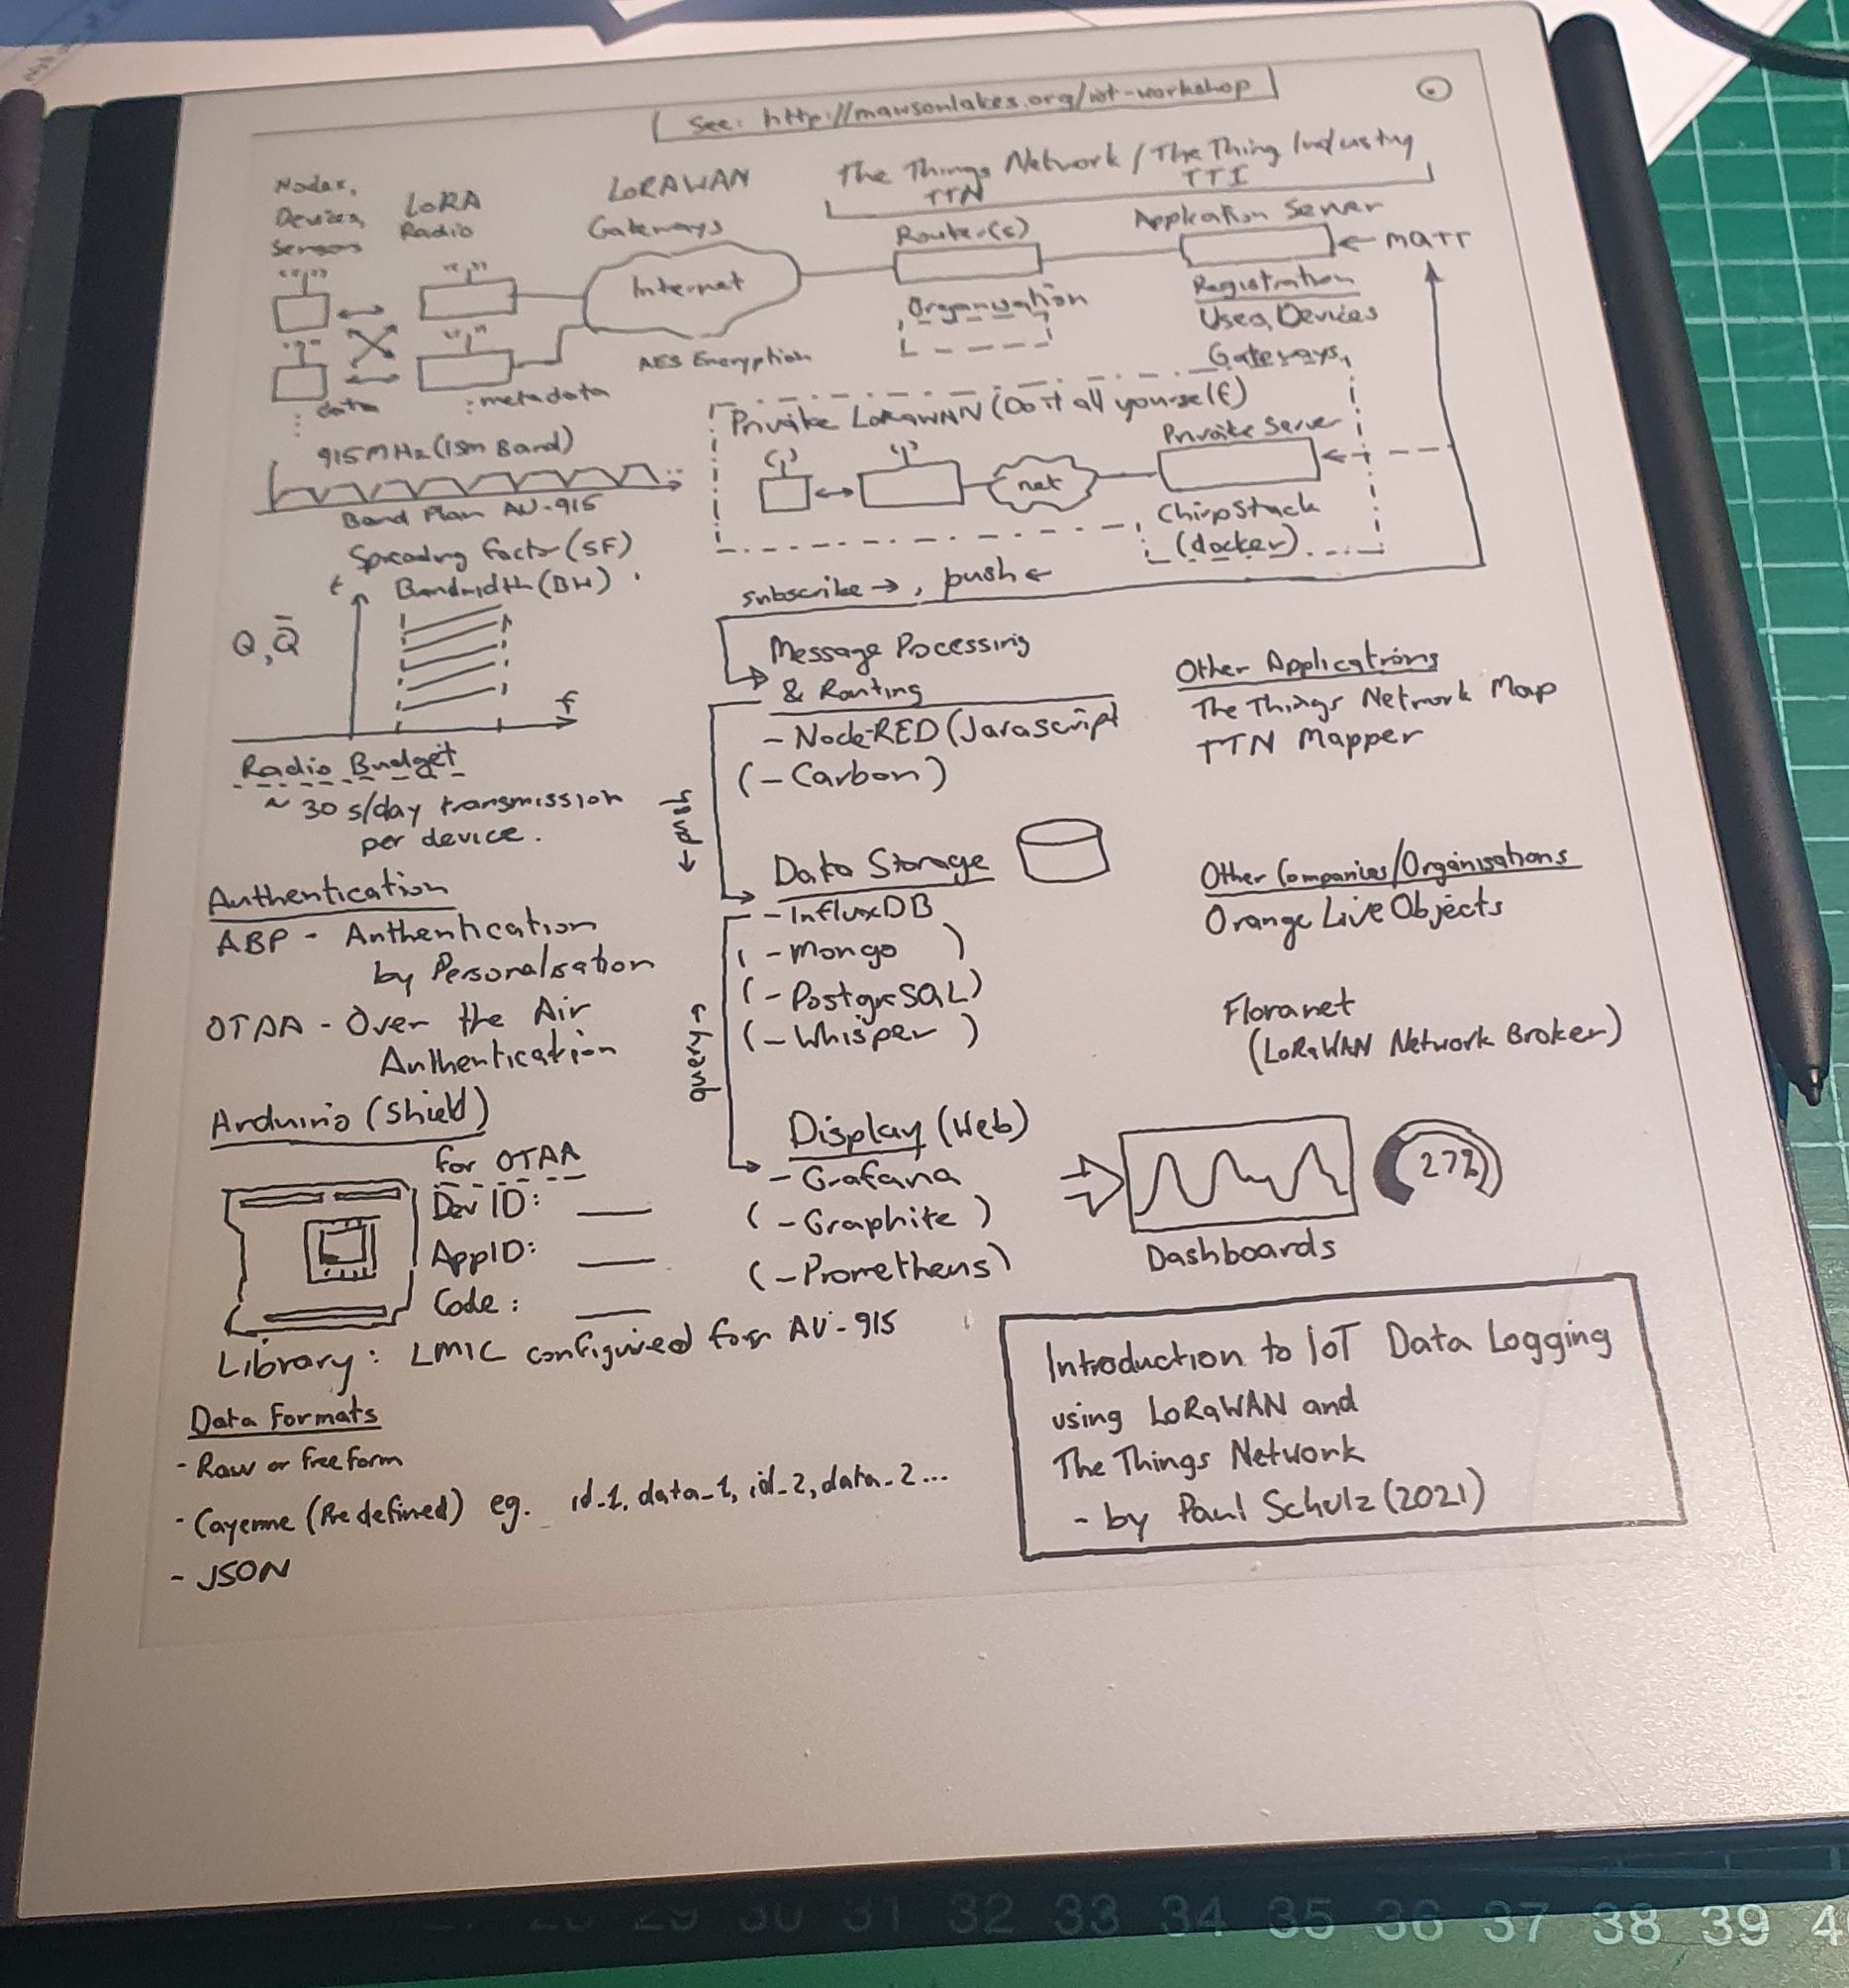
As a birthday present for myself earlier in the year I purchased a “reMarkable 2” e-ink tablet and it’s been awesome. More details about the device below (for those that are interested) but I recently had the chance to use it in a 1-1 meeting covering the PAE IoT Workshop and it worked really well as a paper notebook substitute. Afterwards I was able to go over the details, tidy them up, and rearrange them into a more sensible layout (rather than the original messy stream of consciousness).
Drawing on the reMarkable2
The tablet allows hand written text and drawings to be systematically edited, rearranged and replaced. There is the option on having layers (which I didn”t really use) and showing an underlying templete (lots to choose from) which is a useful guide for keeping everything nicely lined up, and which can be removed afterwards (replaced with the blank one).
The final result can emailed as PDF, PNG, or SVG formatted files, and the result is below.
About IoT Data Logging using LoRaWAN
The following is an example of the path which might be taken by a packet of date, created on a LoRaWAN IoT device, as it makes it’s way from the sensor to be displayed on a web-based dashboard on the Internet.
About the reMarkable2
There is quite a lot to talk about with the reMarkable2 but where is a vary brief summary – it’s a Linux based ARM system, which has Wifi access and drives a e-Ink display with stylus for drawing and input. The display and pen software is closed source, but everything else appears to be Free and Open Source Software. It is possible to SSH into the device from both Wifi and USB-C, with a password that is displayed from the settings menu. If you wanted to you could use that the change any of the software on the device but beware – there be dragons.
reMarkable (the company) currently send out software updates regularly (almost monthly), as these also include new features and tweeks.
There are also third party projects (the reHackable project) which make the tablet even more useful, and support the use of the reMarkable in many more ways than the manufacturer may have intended, including replacing the entire operating system. I have not considered doing this just yet.
The Department of Education, South Australia has issued the following anouncement (Link) this evening – Sunday, 15 November
Mawson Lakes School and Preschool will be closed on Monday 16 November following SA Health advice that a student who attends the school is a close contact to someone who has been diagnosed with COVID-19.
People who need to self-isolate will be contacted with further instructions.
A thorough clean of all relevant areas will be carried out. Parents have been notified.
From the South Australian Govenment Website (Link), concern has been expressed regarding anyone visiting the Lyell McEwin Hospital.
Anyone who was in the LMH emergency department between 5.30 pm Friday 13 November and 4.00 am Saturday 14 November who has not been contacted by SA Health should self-quarantine immediately and contact the SA COVID-19 Information Line on 1800 253 787.
In addition, anyone who was at Parafield Plaza Supermarket on Thursday 12 November between 10:30 am and 11:30 am should monitor for symptoms and get tested as soon as symptoms appear.
The local Councillor for the City of Salisbury, Beau Brug is covering these announcements on his Facebook page – here
If you think you may have been exposed or have symptoms, a Popup Testing Site has been set up at Parafield Airport. SA Health Facebook
Updates
Monday, 16 Nov 2020 – The event is now being called the “Parafield Cluster”, and now has 17 cases.
Contact Tracing details from SA Health – Includes locations (eg. shops) and services (eg. Bus services) with details of where and when contact with the virus may have occurred.
Affected locations (check the above site for specific times):
Elizabeth Vale, Lyell McEwin Hospital
Elizabeth, The Aquadome
Mawson Lakes, Mawson Lakes School and Preschool
Salisbury Downs, Thomas More College
Parafield Plaza Supermarket
Port Adelaide, Hungry Jacks
Anglicare SA Aged Care Facility, Brompton
Yatala Labour Prison
Salisbury Bus Interchange
Salisbury City Fruit Bowl
Elizabeth Shopping Centre, Harris Scarf
Hollywood Plaza – Surgery, Woolworths, Star Discount Chemist
Mantra on Frome
Enfield, Ekam Indian Groceries, Enfield Plaza
Mawson Lakes, Mint Leaf Lounge
Adelaide, Bus Stops – Internode, Grenfell St; GA1/GA2/GA3 near Train Station
Adelaide, Metro Convenience Pty Ltd, Waymouth St, Adelaide
Monday Evening, 16 Nov 2020 – Additional locations:
Ingle Farm, Coles, Ingle Farm Shopping Centre
Pooraka, On The Run, 126 Bridge Rd
Woodville South, Woodville Pizza Bar, 1/58 Woodville Rd
Tuesday, 17 Nov 2020 – Additional locations added, see contract tracing page for times:
Parabanks, Namaste Supermarket
Eastwood, Adelaide Eye and Lase Centre, 215 Greenhill Road
Edinburgh, SA Structural Steel, 5 Kaurna Ave
Elizabeth, BigW
Fulham Gardens, Community Centre – Festival of Lights Function
Findon, Woolworths
Gepps Cross, Spotlight
Mawson Lakes, Foodland
Parafield Gardens, Martins Road Family Medical Practice (Podiatrist)
Woohoo! A new project, or at the very least some new stuff to learn about. It’s been a while since I learnt about the basics of VLSI design and, in particular the ‘Magic’ chip design software package.
Google have just announced that they are partnering with SkyWater Technology Foundry to produce the “SkyWater Open Source PDK“, to produce a fully open Process Design Kit, for producing VLSI Chips. The 130nm process isn’t the newest, but it is still suitable for a variety of hardware applications.
As part of this collaboration, Google has also announced that they will be sponsoring a chip fabrication run later in the year, completely free for the chosen projects, when all the project code, file and documentation is Free and Open Source.
I’m not sure about you, but I have always loved the thought of producing a custom designed chip, otherwise known as an ASIC (Application Specific Integrated Circuit). There is going to be a whole bunch of things that I am going to have to learn, but being involved in the process of producing something like that will be awesome.
The aim is produce the design with cells provided in the SkyWater PDK. The initial proposal is that there will approximately 10mm^2 apace available (Maybe 3mm x 3mm). The 130nm process would there allow an area of 10,000 x 10,000 transistors ( Very roughly, if the transistors were 300nm in size. 3×10^-3 / (0.3 x 10^-6) = 10 x 10^3 )
Any-ho, this should be a lot of fun… and the Skywater-PDK Slack community has been particularly helpful.
After two years of delay, our household now has a chicken coop and five chickens (Bigbird, Tiny, Rose, Flame and Raptor).
Part of the plan other then getting the birds to produce eggs, eat garden waste, poop and generally scratch around, was to use this opportunity to turn their humble home into a Super Chicken House..
Currently, they need to be shut in and let our every day which which is not much of a chore but still needs to be done. Also, it would be nice to know when there are eggs to be collected, and if they need more water or food. Some temperature monitoring might also be ‘cool’ as well as air quality sensing.
As an acknowledgement to some other great work being done on home automation, the name and logo of the project had been blatantly copied and modified from Jon Oxer’s SuperHouse Automation business. (Does this classify as Fan art?)
Solar Power
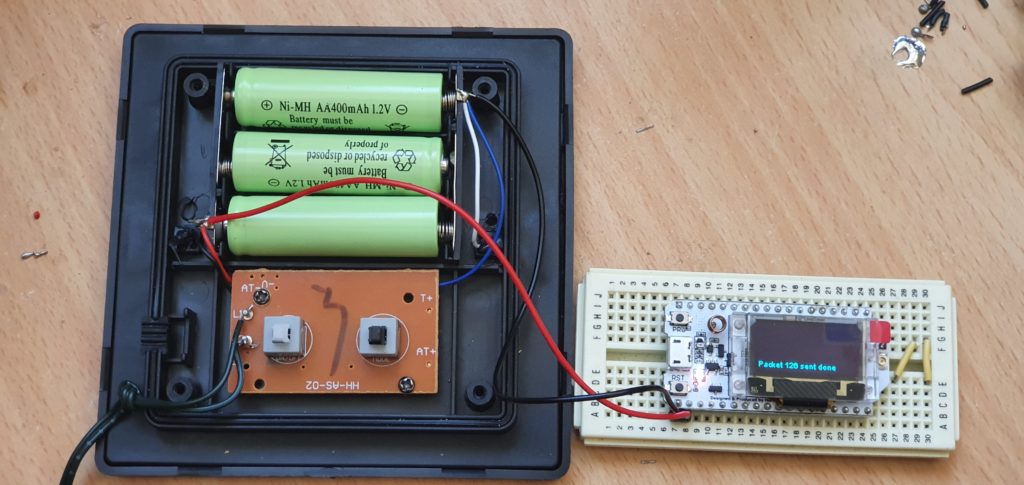
I was struggling to find a reasonable cheap way to get power to the SuperCookHouse. I had some sets of solar powered garden fairy lights, several different models to experiment with. They all had internal batteries which charged up during the day and then automatically switched on at night.
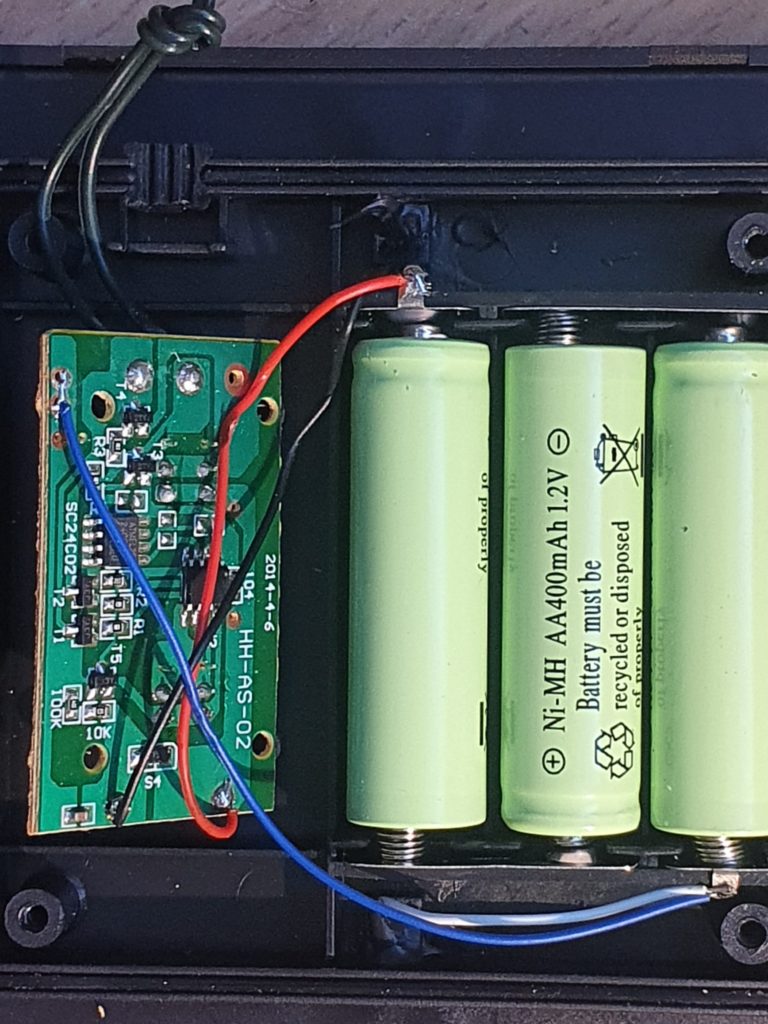
The smaller units had multiple outputs on for their LED’s (three wires) which allowed them to have some interesting twinkle modes. They were cheaper, but they only contained a single Ni-MH battery. The larger unit had three batteries (see image below) but only had a two wire LED output. The cases themselves also had some rubber seals for waterproofing.
Inside connections and batteries of larger Solar Fairly Light unit.
In the larger unit the output from the charged batteries was 4.1V. This proved sufficient to power up a Heltec WiFi LoRa 32 (V2) board which I had at hand. This was connected directly across the batteries.
Connecting a device directly across the batteries.
This connection bypasses the power switch and the flashing circuit of the solar panel board. The batteries should still be able to be charged via the solar panel.
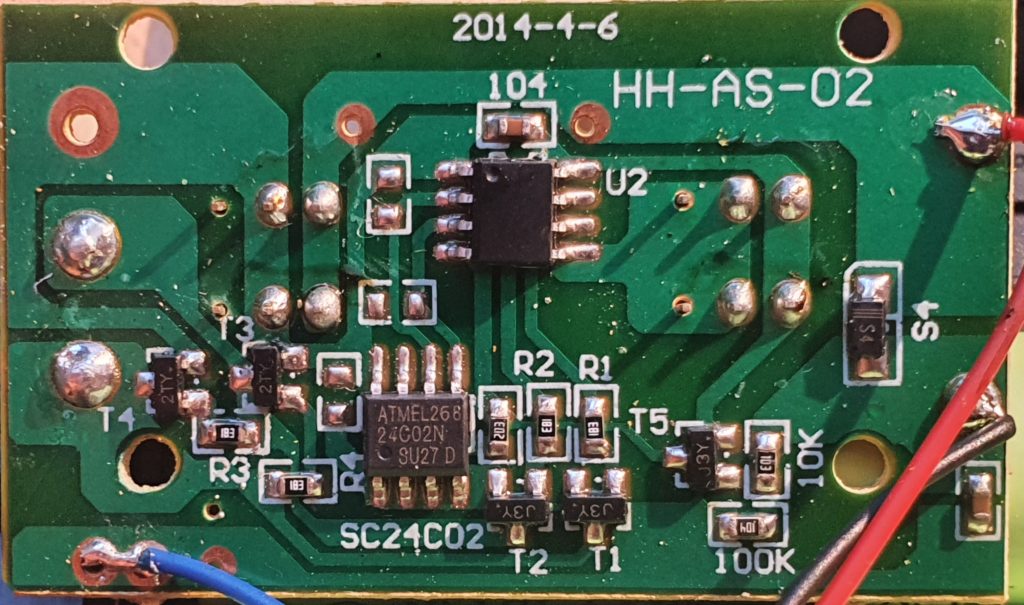
The single-sided controller board.
Briefly looking at the control board, with some hackery, it should be possible to make use of the on/off switch to control external power, but two other modifications would also need to be made;
bypass the flashing circuit
disable the ‘power off’ function when the solar panel is in light.
This work has been left to a time in the future.
Update: The batteries powered the module, as it was without any sensors, for about three hours.
Update 2: It looks like the chip SC24C02 (ATMEL268 24C02N) is an EEPROM 2-wire 2K memory chip (Datasheet). Pins 5 and 6 are the Serial Data (SDA) and Serial Clock Input (SCL) respectfully, which are routed up to pins 2 and 3 on the other (currently unknown) package.
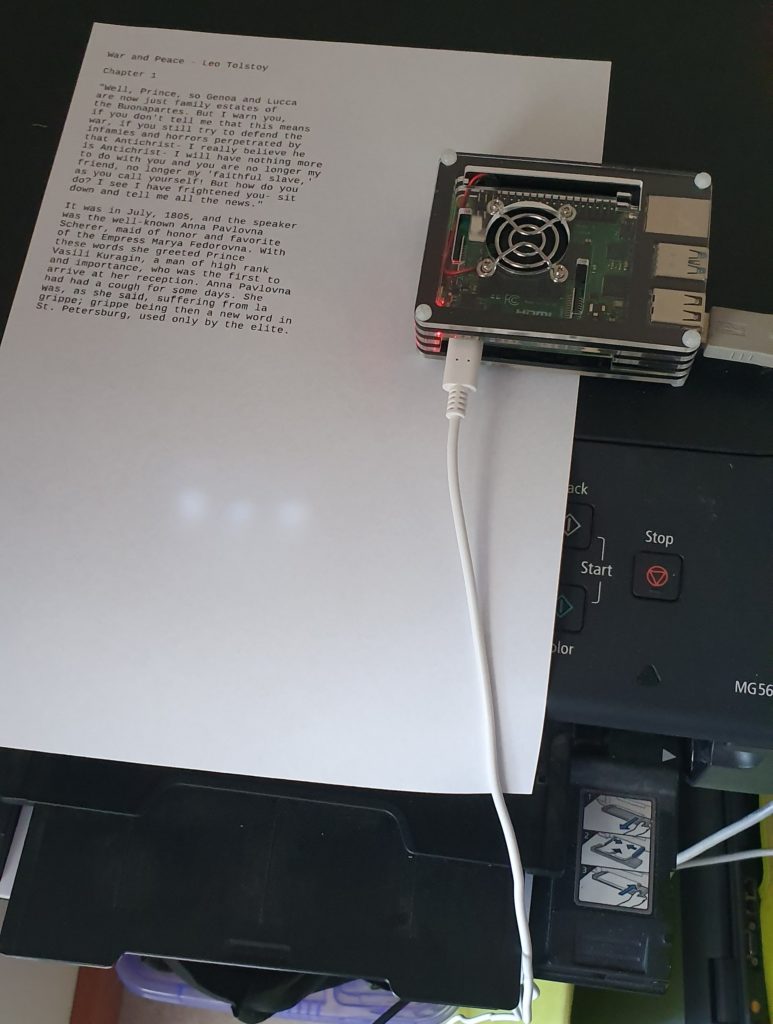
Work has begun to create a robot for dispensing short stories at the touch of a button for Writers Week in 2020. The Storybot will be located in one of the Port Adelaide Enfield libraries and will print from it’s collection of pre-curated stories onto paper via a thermal printer for library patrons to take away with them.
Design
The initial design of the Storybot uses the following parts:
Raspberry Pi 4, with MicroSD card
Thermal Receipt Printer, USB (24V)
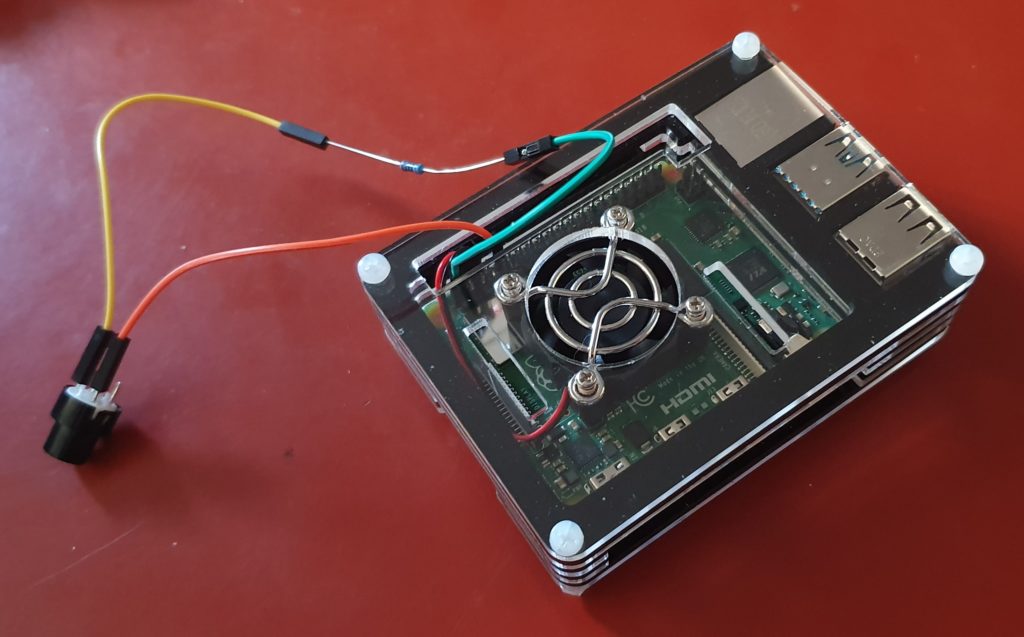
Button, resistor (220 Ohm) and connecting wire
Power supply (for Rasperry Pi and Printer)
Enclosure and stand
Intial print testing was done with a regular Canon USB Pixma printer.
Software
A repository of the code created for the Storybot can be found on GitHub. This repository ‘storybot’ is cloned directly into a subdirectory of the ‘pi’ user (in our case we are using ‘Document/git’).
The Raspberry Pi used has the most recent Raspbian installed which has been updated to the latest packages.
In addition, the CUPS Printing package has been installed, which allows Raspberry Pi to print to any of the supported printers including the receipt format thermal printer. This printer prints 40 column per row with a fixed width.
A quick solution[1] for selecting a random story used the ‘fortune‘[2] package.
Stories are copied to a directory on the Raspberry Pi as individual ASCII text files. Some example files have been created for testing purposes[3]. A global data file and index is created from these files, while also reformatting them for a 40 character line length. Fortune reads these files, and will extract a story and print it.
Story management is driven by a global Makefile with the following targets:
    make help    - this message (default)
    make story   - display a story
    make prepare - compile the stories into data file
                 (This will be run automatically, if required.)
    make list    - list story files
    make clean   - reset system by removing generated files
    make status  - display system status
This system allows dependencies to be managed, so that ‘make prepare’ would be run if it is required and hasn’t yet been run, before ‘make story’. This allows new story uploads to be done even while the system may be printing.
Printing is done by sending (piping) the story output directly to the default printer with
make story | lpr
Adding a button
To detect a button press, where a button has been wired up to a GPIO pin, there are several options available. These still need to be investigated, but they include: Node-RED, WiringPi (C code and used in a previous project) or RPi.GPIO (Python)
Node-RED: This is a large-ish application, but it works well and does not require any addional configuration on system start-up and shut-down.
WiringPi: This C/C++library is useful for creating lightweight binary programs, but requires additional configuration to enable the created files to restart on reboot/startup. It is no longer being activity supported by it’s developer, but is open source software.
RPi.GPIO: Python library that together with Python makes writing scripts that interact with the GPIO on the RasberryPi very easy.
Each of these approaches will need to take care of button bounce/noisy inputs, and stop multiple press events happening in a short period. Some hardware conditioning may also be necessary.
Notes: [1] Very quick. There are no options for recording any statistics about which stories are printed, or when, which might be a useful thing to record and report on. [2] The fortune package has a very long history, originally appearing in very early editions of UNIX operating systems. [3] Stories fro testing were created from the inital paragraphs from “The Princess Bride”, “War and Peace” and “A Tale of Two Cities”.
In the last part of this blog post series, we look at pulling everything together with InfluxDB and Grafana to store and display outr IoT sensor data.
Tools to Collect and Display Data
In the workshop we are using the following software tools for processing our collected data.
Node-RED – Receive, Process and Push IoT sensor data
InfluxDB – Store the time series of sensor data
Grafana – Display and manipulate the data visualisation
These packages can easily be installed on a Ubuntu system (desktop or laptop) as well as Raspberry Pi Raspian system[1]. In the following I have included the instructions for installing on Ubuntu.
This combination of software will allow data to be displayed is graphs which can be interactively arranged and manipulated, and shared with multiple users on your network.
Node-RED
The installation and configuration of Node-RED was discussed in the previous post. An additional module needs to be install to allow Node-RED to send data to InfluxDB.
node-red-contrib-influxdb
InfluxDB
InfluxBD is a time series data store, which is like a database, but different. It is designed for storing and retrieving sequential data which contains timestamps in a more efficient way.
To install
$ sudo apt install influxdb influxdb-client
It uses the default port of 8086.
Before we are able to start storing data, a database needs to be created in InfluxDB, which we can then push our time series data into. This is done from the Linux commad line ($) as follows: First open a influx prompt (>), then create the ‘iot’ database.
$ influx -precision rfc3339
> create database iot
From the influx prompt (>) you can find out more about the available databases
> show databases
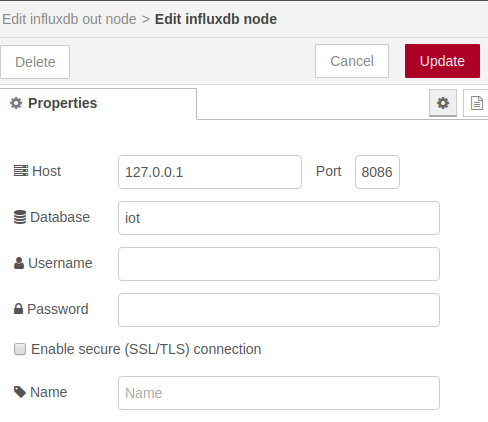
Node-RED can then be configured to push data to this database with the InfluxDB output node, configured as follows.
Configuring InfluxDB node to write to local InfluxDB instance.
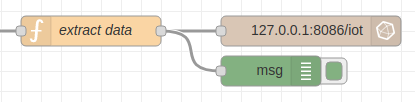
A flow can then be configured to pull the data from a Node-RED message and send it to the InfluxDB.
The function used to extract moisture data (analog to digital data in the range 0-1023) is as follows. An additional format check (message starts with “Sensor”) has been added in case some other format is received. The device (device_id) that is reporting the data is specified in the ‘msg.measurement’ field.
var payload = msg.payload.payload_fields.receivedString
var dev_id  = msg.payload.dev_id
var re      = /^Sensor/;
var moisture = 0.0;
if(re.test(payload)){
   payload = payload.substring(10)
   var integer = parseInt(payload,16)
   moisture = integer/1024.0 * 100.0
 }
 msg.measurement = dev_id
 msg.payload = moisture
 return msg;
Grafana
Grafana is a graphing and visualisation package. It can display the information from InfluxDB[3] and display it.
When logging in for the first time, you can use any username and password and you will be then prompted to change it.
Grafana is a very powerful piece of software but does a good job of helping the first time user through the initial setup. It is recommended that you have a read through the Getting Started documentation. The following is a very brief summary of the confugration process, and I have glossed over a lot of the details.
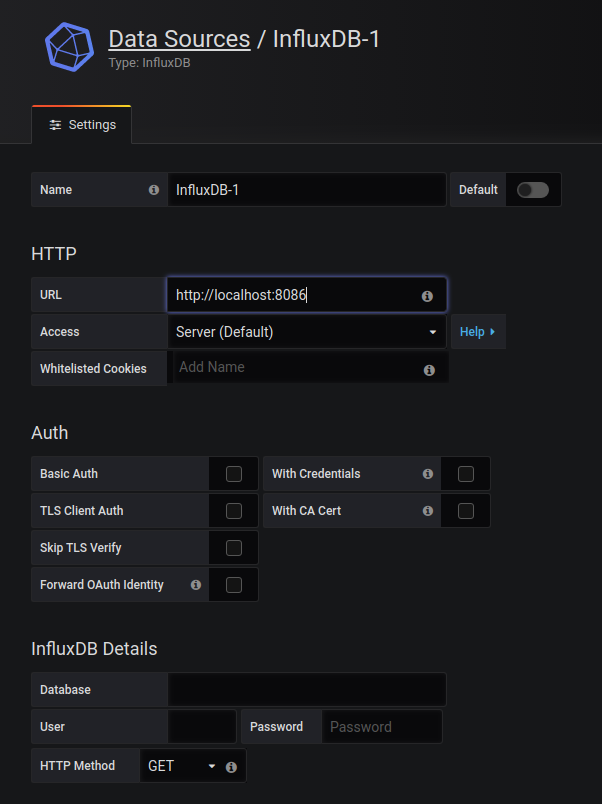
Once you login in, you will then be prompted for a data source. The details to connect to the local InfluxDB is as follows. Click and set the URL to http://localhost:8086 (it may just be displayed in grey which is a trap). There is no username or password needed if InfluxDB is installed as mentioned above.[5]
Grafana data query builder.
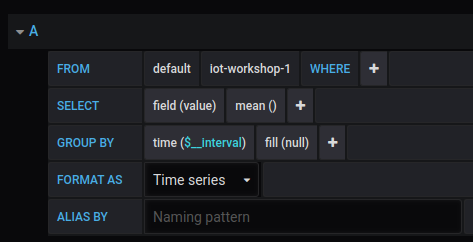
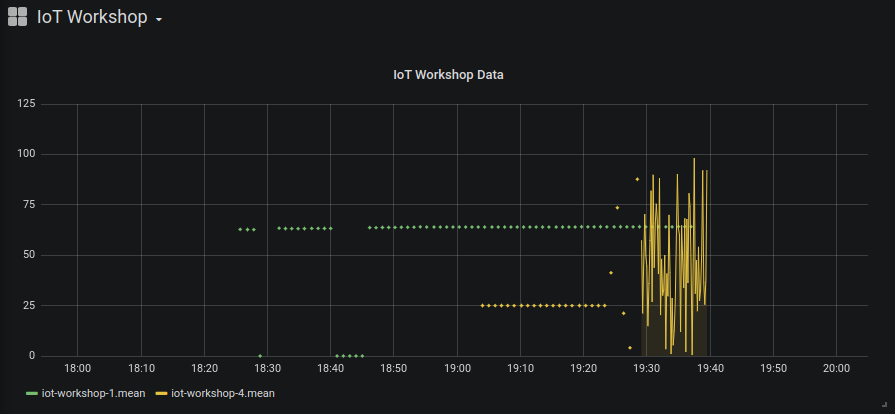
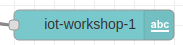
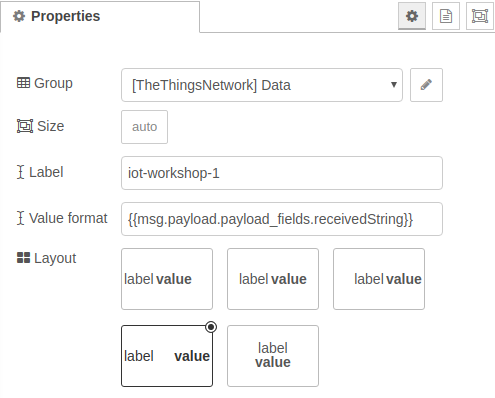
Grafana plots are configured by specifying a data query. In this case we are looking for data from the ‘iot-workshop-1’ device.
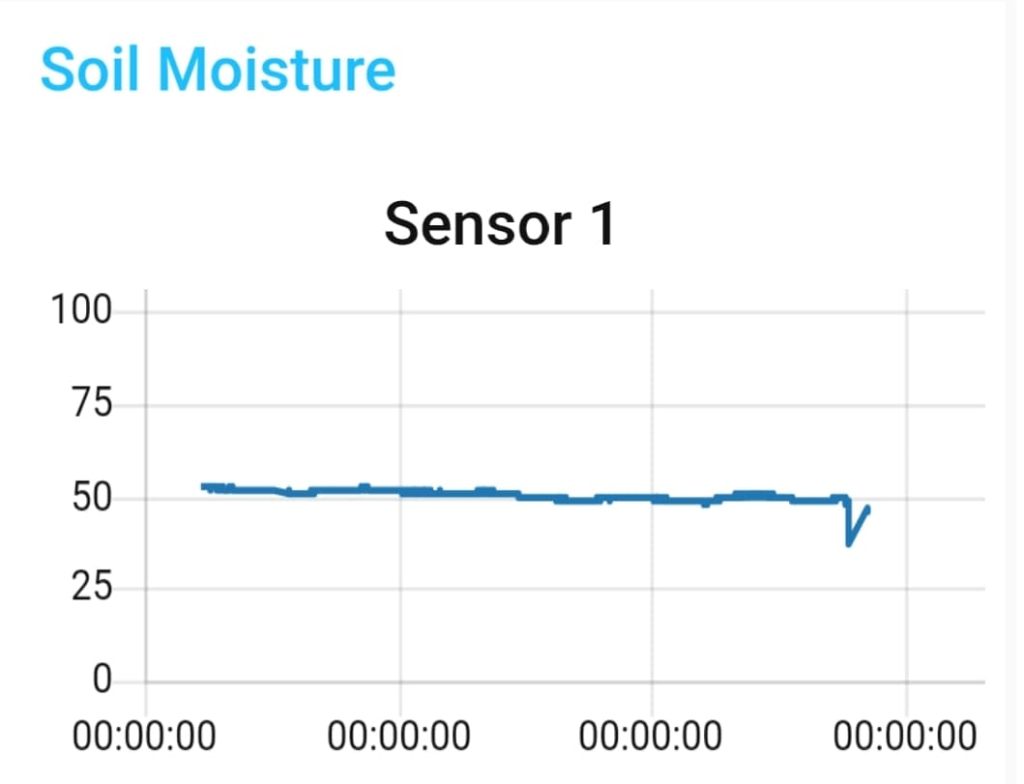
The following resulting plot came from defining two data queries for two IoT devices. The second one was configured to generate random data at 10 second intervals for testing purposes.
This series of posts covered the process of building a private IoT platform for collecting and displaying sensor information that uses the Internet to move data about but does not rely on cloud or other 3rd party hosted services other than The Things Network.
There are no ongoing charges or fees with this system, and it is a good introduction to software which can then be adapated for other purposes. Have a look for YouTube videos on how to connect Node-RED to home management systems (Google Assistant or Amazon’s Echo) or create different dashboards with Grafana plugins
In the third session, we are taking the data and looking at how it can be processed, in this case using the NodeRed tool.
Installation of Node-RED
Node-RED is a web server program which uses Node.js, which can be installed on a home computer, server, Raspberry Pi or in the Cloud. It can be used to collect and process the data collected by The Things Network[1].) We will be using MQTT to get access sensor data.
For supported Operating Systems and installation instructions, see: https://nodered.org/docs/getting-started/
On Linux Operating Systems (Ubuntu, Debian, Endebian etc.), Node-RED can be installed with
It also appears to be installable on Windows 10 using the Windows Subsystem for Linux (WSL)[2].
Once installed, ot can be accessed via web browser connecting to port 1880. If it is installed on the local computer, ot can be accessed by visiting the URL – http://localhost:1880/
A User Guide with Tutorials are available from the Node-RED website[3]. If you have access to a working Node-RED server then the Tutorials are a good way to get started.
One final note. Flows are stored on the computer under the computers name (hostname). It that is ever changed, then the flows will not be loaded and it will look like your configuration has dissapeared. It is still there, and will reappear if the hostname is changed back. The easiest way to fix this is to export your flows to a file first (json) and then import them afterwards. This option is under the main menu.
Once Node-RED has been installed it can be accessed via port 1880.
Some additional packages are required. These are installed via the Manage Palette menu.
node-red-contrib-persist
node-red-dashboard
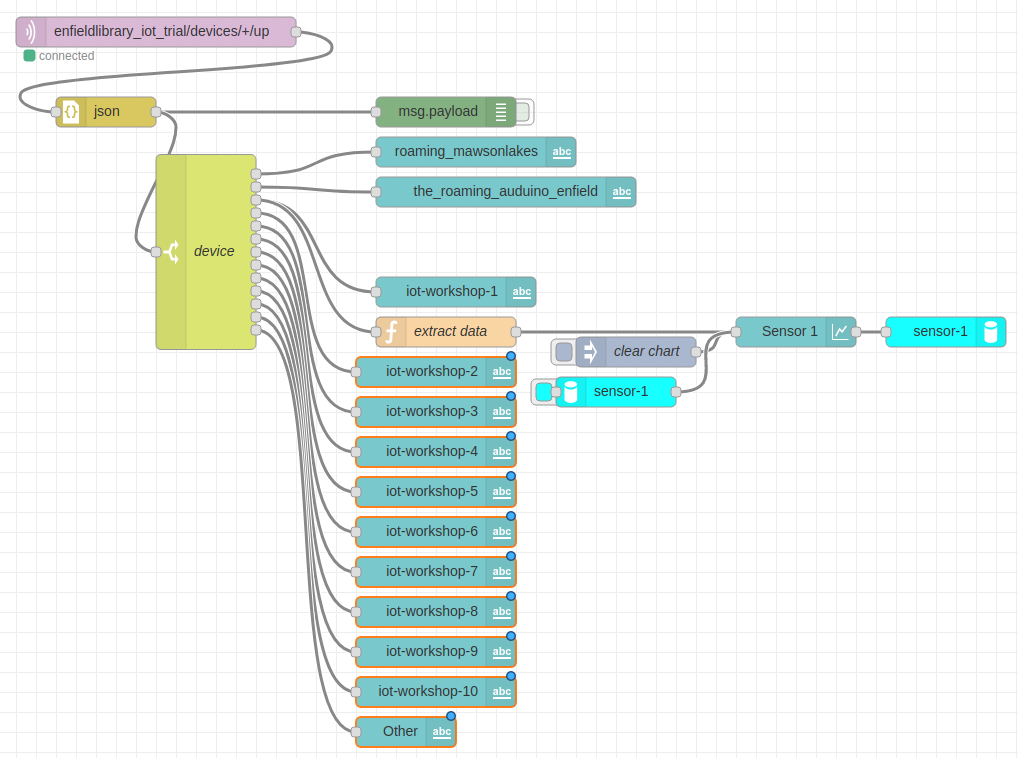
Configuration is done by connecting processing nodes with virtual wires to create flows. This allows messages to be processed as they pass through the system.
A Node-RED flow configured to process IoT data.
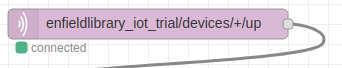
Data collected by The Things Network is pulled into Node-RED by using the MQTT node. This requires the name of The Things Network application and an application key/password.
Add an MQTT node and add a new mqtt-broker (server)
Name: Something memorable eg. Meshed
Connection
Server: thethings.meshed.com.au
Port: 1883
SSL/TLS: (Unchecked)
Use Legacy MQTT 3.1 support: (Checked)
Security
Username: enfieldlibrary_iot_trial
Password: (application-key copied from TTN website, starts with ‘ttn-account-v2’)
The topic is the MQTT channel to subscribe to where ‘+’ is a wildcard and will match any device name.
enfieldlibrary_iot_trial/devices/+/up
There are a range of channels defined in the The Things Network API[1] covering different types of messages. Eg. up, down.
Node Decription
MQTT client
This node connects to The Things Network and subscribes to the defined topic. Any data sent by our LoRaWAN devices will be sent out this node.
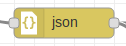
JSON
This node converts a text payload to JSON format. This is useful for allow later nodes to access individual parts of the payload.
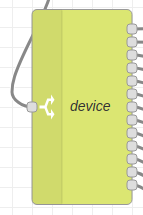
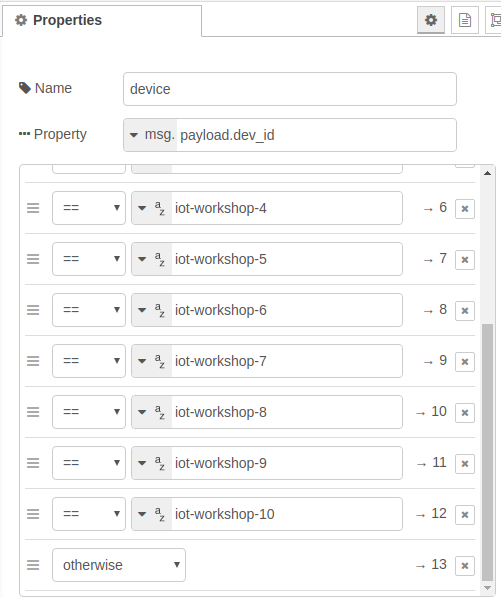
Switch
Diverts messages between different processing flows. In the above flow, it is being used to send device data to different dashboard labels. This allows us to display the latest data coming from each sensor.
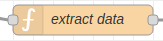
Function
Code can be written in JavaScript to manipulate the messages passed to the node.
In our example we take the data transmitted by our device and received by The Things Network (eg. Sensor: 0x0267)[2], extract the data (substring) and convert to a meaningful number (moisture). This is passed directly to the next node in the payload of the message (the ‘msg’ variable).
var payload = msg.payload.payload_fields.receivedString
payload = payload.substring(10)
var integer = parseInt(payload,16)
var moisture = integer/1024.0 * 100.0
msg.payload = moisture

// To allow plotting of multiple series
msg.label = "sensor-1"

return msg;
Dashboard Label
Creates label elements to display on the dashboard. These are updated by messages.
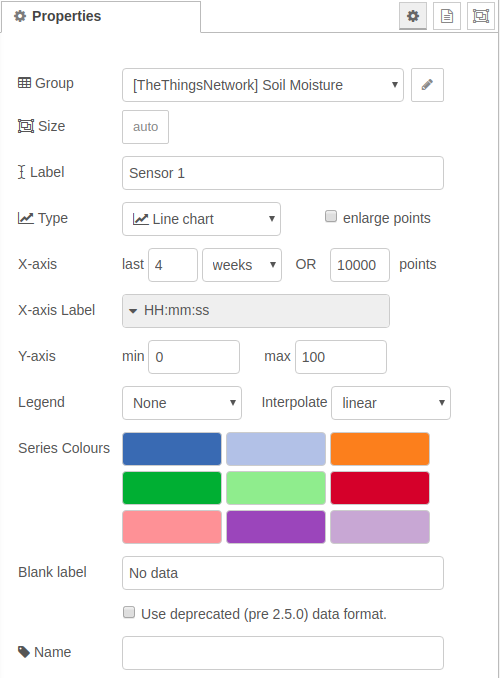
Dashboard Graph
Displays a graph from data. By default, the data is not permanantly stored and will not persist between flow deployments. The graph data can be stored persistantly by including save and restore nodes.
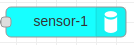
Persist (Save Data / Restore Data)
These nodes are used to ensure that the graphed data is persistent between reboots. Under particular conditions the date is written to a non-volatile location, and is read back into the system when starting up.
Multiple sets of data can be saved, but the save and restore nodes need to match.
The nodes above can be used in Node-RED to receive, display, graph and store data from LoRaWAN enabled sensors. It is a general purpose system and as such is missing some of the whistles and bells of some other systems.
Improvements can be made by hooking in some additional software packages. In particular, data can be stored in a database specifically designed to hold time series of sensor data (eg. InfluxDB[1]) and a more functional dashboard can be added for better graphing and analysis (eg. Grafana[2]).
In the previous post we discussed the LoRaWAN network and gave an overview of how it works end to end. This post looks in more detail and describes what’s necessary to get data into the network from individual sensors.
The LoRa Radio and LoRaWAN
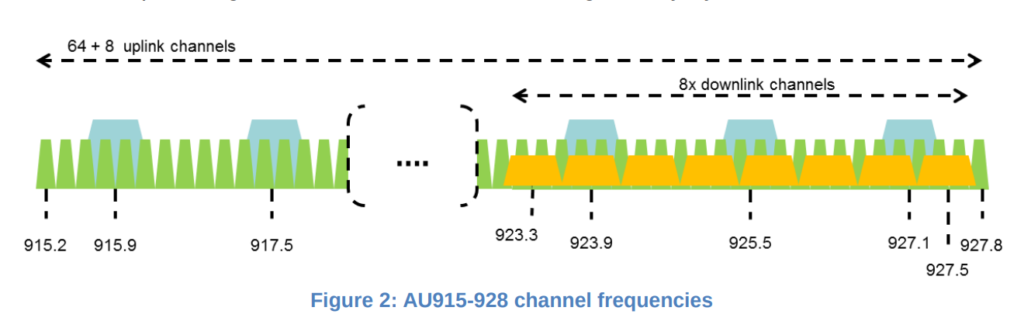
The LoRa radio module transmits in the Industrial , Scientific and Medical (ISM) unlicensed radio band[1]. In Australia (and New Zealand) LoRa transmits between 915-928 MHz[2]. For uploading data, the band is divided into 64 narrow bandwidth channels of 125 kHz, with an additional 8 overlapping broader channels of 500 kHz.
The data is encoded using a chirp signal. The rate that this frequency changes is defined by a ‘spreading factor’ (SF), and a doubling of the spreading factor approximately doubles the amount of time it take to transmit data[3].
LoRaWAN Channel Allocation for Australia and New Zealand
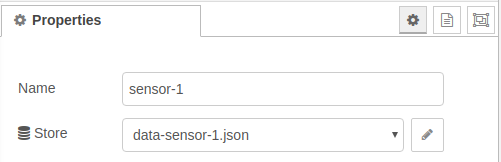
To use LoRa and LoRaWAN we are using the following LoRaWAN Arduino Shield available from the local suppliers. It is supplied to transmit and receive in the 915 MHz. As purchased the jumpers were not set, and needed to be installed as indicated in the picture below.
When developing hardware, it is only possible to use digital input/outputs 3,4 and 5 (3 lines). Digital IO 0 and 1 are used by serial IO and interfere with programmng. The digital lines D11-13 are used to control the LoRa radio.
The available Arduino pins for projects are
D3-5 (3 digital lines) – Can be sed for Digital IO
D0-1 (2 digital lines) – Can be used for Digital IO but interferes with in circuit programming. Needs to be disconnected first.
A0-5 – Canbe used for Analog Input or Digital IO
SCL,SDA – Can be used for Digital IO and Analog In on Arduni Uno.
AREF – Used as analog reference voltage
GND – Ground
Software
Arduino Library for LoRaWAN (LMIC)
The Arduino LMIC library that we are using is being maintained by Thomas Laurenson and can be found on Github[1]. The original LMIC Library was written by IBM and has been ported for use with the Arduino board.
Once downloaded and installed in the Ardiuino IDE library directory[2], the software needs to be configured to use the Australian frequency plan which is done by editing the file ‘project_config/lmic_project_config.h’. For some reason the Australian configuration is called CFG_au921.
Notes: [1] Github: https://github.com/thomaslaurenson/arduino-lmic [2] When unzipping the software, there may be duplicated recursive top level directory names (eg. arduino-lmic/arduino-lmic). Ensure that only one level is copied into Arduino library folder.
Example Arduino Sketch
An example Arduino sketch also available from the GitHub repository, which can be used to connect to the LoRaWAN network. See arduino-lmic/examples/ttn-otaa-dragino-lorashield-au915[1].
When connecting to the LoRaWAN network there are two authentication methods “Authtication by Personalisation” (ABP) and “Over the Air Authentication” (OTAA). While it is a little more complicated, OTAA is preferred as it allows the network more control over the authentication process, but requires two-way communication with the end-node. ABP does not require the end-node to receive data from the network but the network needs to know when the end-node is ever reset[2].
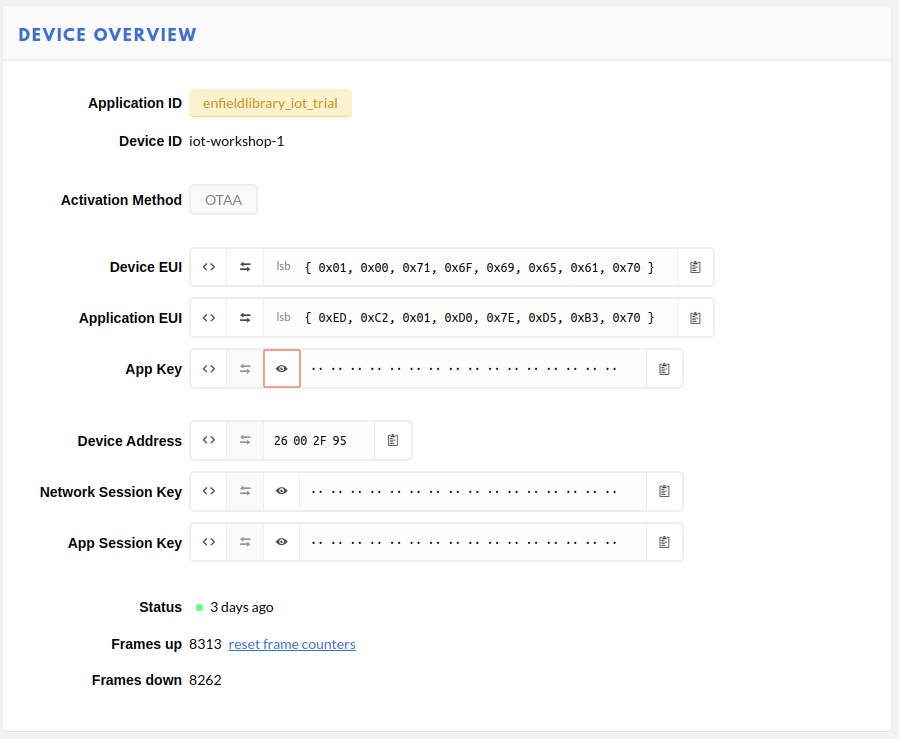
For OTAA, there are three pieces of data that need to be copied into the sketch, and are obtained from The Things Network console[3].
Device EUI (DEVEUI) – This is the unique identifier for this device on the network. This can be changed. This needs to be used in the sketch in Least Significant Byte (lsb) order.
Application EUI – This is the application identifier, and is unique across the LoRAWAN network. This needs to be used in the sketch in Least Significant Byte (lsb) order.
Application Key – This is an initial encryption key shared between the Node and Application. It can be changed. This needs to be used in sketch in Most Significant Byte (msb) order.
The webpage tries to make this as easy as possible by allowing you to adjust the formatting and the copy to clipboard button.
Device confiuration parameters in The Things Network
These details are copied into the Arduino sketch in the FILLMEIN locations as shown below.
// This EUI must be in little-endian format, so least-significant-byte
// first. When copying an EUI from ttnctl output, this means to reverse
// the bytes. For TTN issued EUIs the last bytes should be 0xD5, 0xB3,
// 0x70.
static const u1_t PROGMEM APPEUI[8]= { FILLMEIN };
void os_getArtEui (u1_t* buf) { memcpy_P(buf, APPEUI, 8);}

// This should also be in little endian format, see above.
static const u1_t PROGMEM DEVEUI[8]= { FILLMEIN };
void os_getDevEui (u1_t* buf) { memcpy_P(buf, DEVEUI, 8);

// This key should be in big endian format (or, since it is not really a
// number but a block of memory, endianness does not really apply). In
// practice, a key taken from the TTN console can be copied as-is.
static const u1_t PROGMEM APPKEY[16] = { FILLMEIN };
void os_getDevKey (u1_t* buf) {  memcpy_P(buf, APPKEY, 16);}
In the sketch, the following line can also be changed.
static uint8_t mydata[] = "OTAA"
This is the data that is going to transmitted over the network. This short string can be edited to something more meaningful. The sketch can then be compiled and installed, and if a LoRaWAN Gateway is within range, transmitted data will start to be collected by The Things Network Application.
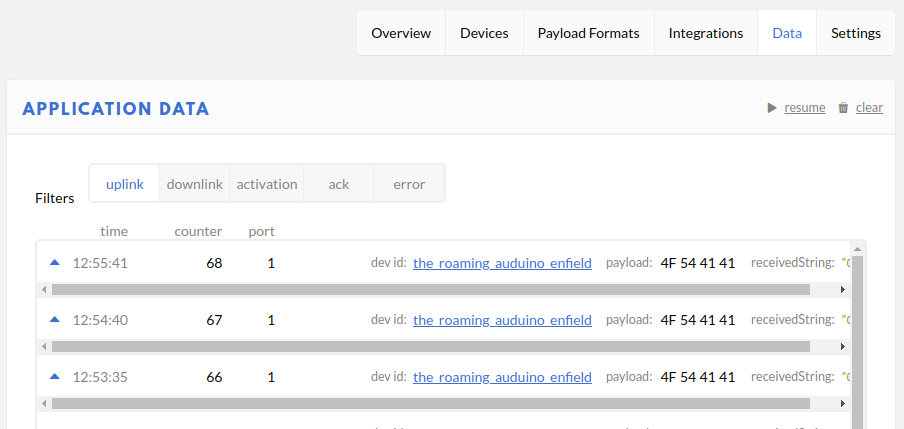
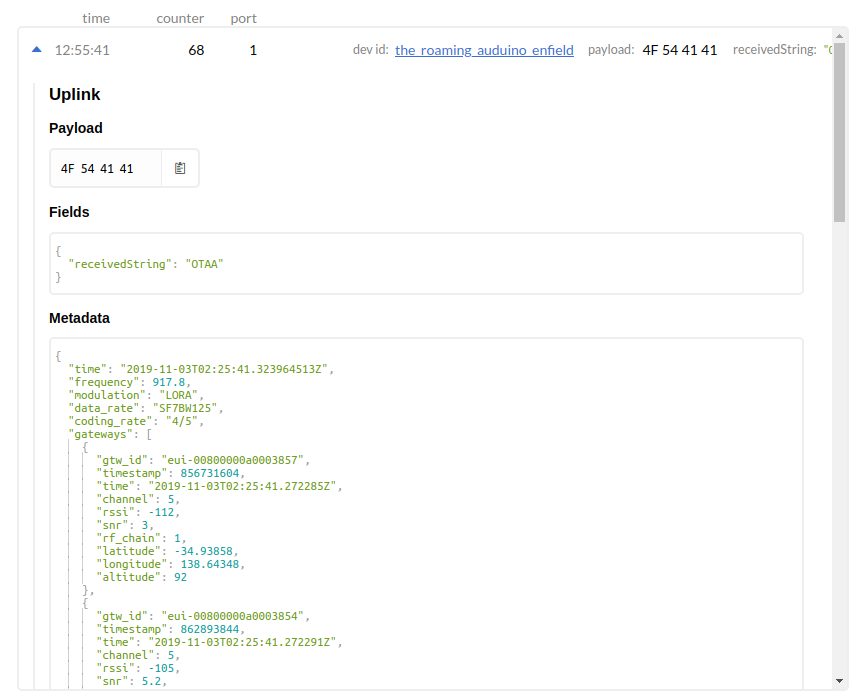
The transmitted packet data will appear under the Application Data on The Things Network.
Data packets being received from an IoT device via LoRaWAN
The information includes the data transmitted by the IoT device and metadata from the network about the transmission. Expanding the packet entry shows this detail.
In the case above, to assist with debugging a custom Payload Format decoder has been added which converts the bytes to a string with can be seen in the ‘receivedString’ field[1].
// Decode an uplink message from a buffer
// (array) of bytes to an object of fields.
function Decoder(bytes, port) {
   // var decoded = {};
   // if (port === 1) decoded.led = bytes[0];
   // return decoded;

   // Decode plain text; for testing only
   return {
       receivedString: String.fromCharCode.apply(null, bytes)
   };
 }
The raw transmitted data can be seen in the Payload.
The metadata fields show the frequency used (917.8 MHz), the datarate (SF7BW125 – Spreading Factor 7, Bandwidth 125 kHz) and the gateways which heard the transmission and their details.
The next step will be to look at how to make use of the collected data. NodeRed is a software package will be used to process and manipulate the data as it is received.
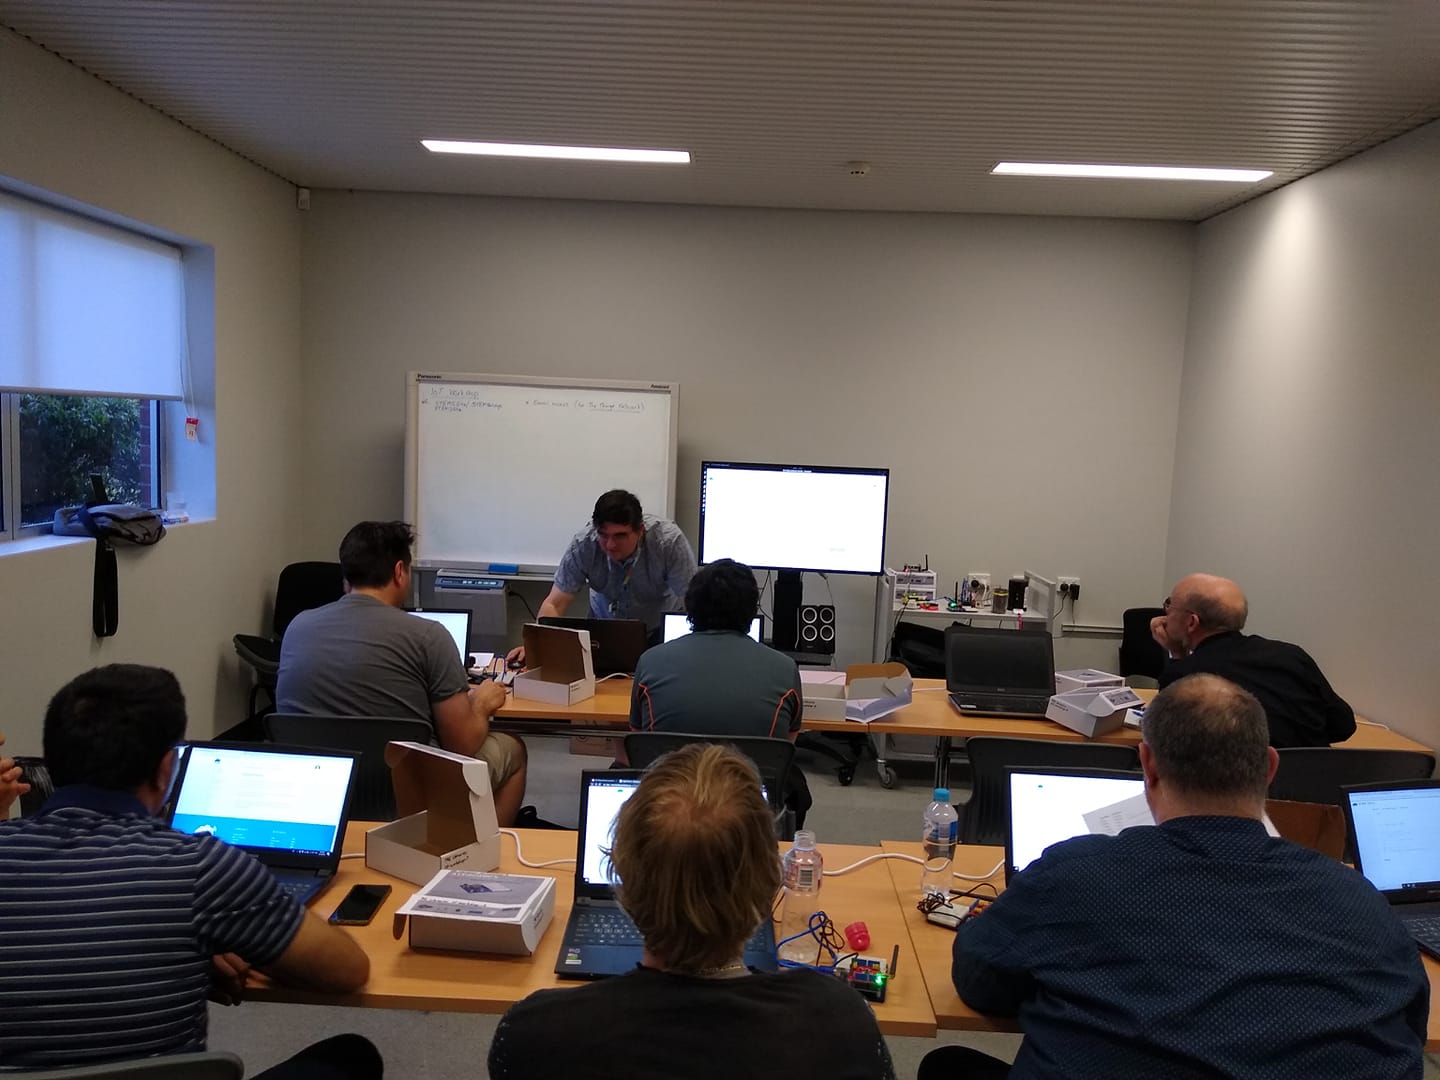
On Thursday (24 Oct 2019) we started running the first session of a new IoT workshop, being held at the local libray (Enfield Branch of the Port Adelaide Enfield Council). This workshop aims to be an introduction to creating sensors and nodes for the LoRaWAN IoT network, using The Things Network website.
This first sesssion (of four) was a whirlwind dump of details which we will unpack and work on through the remainder of the sessions, with hands on electroncs and programming.
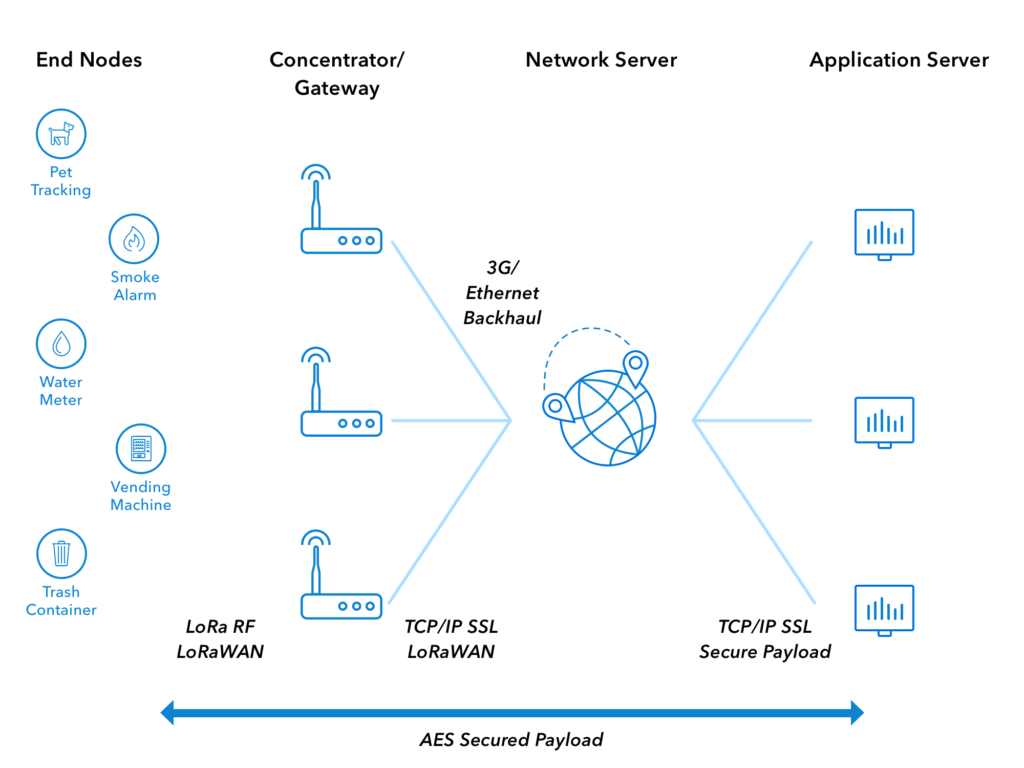
We went though the architecture of the system and got everyone to create an account on The Things Network, and set them up so that they could see the IoT data that was being transmitted over the network.
Architecture of LoRAWAN Network (from The Things Network)
Technolgy discussed..
A quick summary of the various bits-n-pieces that are being used follows.
LoRa
The radio technology that is used by sensors for ‘Long Range’, low bandwidth communication. These radios may be programmed to be used in either point-to-point or point-to-gateway (LoRaWAN) mode, configurable with software. They use the unlicensed ISM radio bands, 911MHz in Australia.
The radio network and infrastructure used to collect sensor data, via publically accessible gateways.
Arduino
A microprocessor board and programming tools, which use the Atmel (and other) microprocessor. The original aim was to create a programming system which was easy to use for hobbyists and members of the maker community. Arduino microprocessor boards can be used with a LoRa radio to create sensors which can transmit data via LoRAWAN and the internet to be collected and used by other applications. https://www.arduino.cc/
Arduino Shield
This is additional hardware that has been designed to plug directly into an Arduino board and allow it to be easy to use.
Arduino IDE
The Interactive Development Environment (IDE) used to program an Arduino microprocessor board. It is available as a downloadable Java program, and as a web based application. The software is available from the Arduino website.
Arduino Libraries
Additional software packages which can be installed to extend Arduino programs. For example, the LMIC library is used to allow our Arduino programs to use the LoRaWAN radio shield.
Libraries can be downloaded from within the Arduino IDE, or downloaded and installed manually.
LoRaWAN Sensor Node
A device which collects data and transmits to the LoRaWAN network. It uses a LoRa radio. They need to be registered and authenticated with the LoRaWAN network to transmit correctly.
LoRaWAN Gateway
A device which listens for LoRaWAN radio transmissions from nodes in its area and forwards them to the servers on the LoRaWAN network. They need to be connected to the internet and be registered to operate.
The Things Network
A free website (registration required) which allows access to data collected by LoRaWAN sensors. It is used to register LoRaWAN gateways on the network, and create LoRaWAN applications.
MQ Telemetry Transport. This is the communication software and protocol used to allow sensor data to be distributed and used once it has been collected by The Things Network.
NodeRed
A web server program, which can be installed on a home computer or server (or Raspberry Pi) which can collect and use sensor data collected. It uses MQTT to access sensor data.
NodeRed is an automation environment and is useful for a lot more than collecting and displaying our IoT data. See the website for more details.